The Next Best Action Playbook > Chapter 1: Segmentation
Customer segmentation: from RFM to predictive segments
Every customer segment you’ve ever built is a photograph. It was accurate the moment someone took it, and it has been drifting ever since. That’s fine for understanding a customer base. It’s a problem the moment you use the photograph to decide what to send a customer tomorrow, because the customer has moved and the segment hasn’t.
Customer segmentation is the practice of dividing your customer base into groups that share characteristics or behaviors, so you can treat each group differently. The classic versions group by who people are (demographics), where they are (geography), how they think (psychographics) and what they’ve done (behavior). RFM analysis is the best-known behavioral method and still the one most B2C teams run. All of them look backward.
This chapter walks through the classic types, works a real RFM example, shows exactly where RFM breaks, and then explains the thing that replaces it at scale: predictive segments, defined by what customers will do next and refreshed every night. It’s the first rung of the decisioning ladder, and the rest of the playbook stands on it.

The four classic types of customer segmentation
Demographic segmentation groups customers by age, income, household size, life stage. For a baby food subscription it’s the whole business: a household with a six-month-old and a household with a six-year-old want different things, and the first one will age out in a year no matter what you send. Demographics explain the market. They rarely explain which of two 34-year-olds in the same zip code will reorder.
Geographic segmentation groups by location, and in B2C it’s more useful than it sounds. An insurer prices by state. A meal-kit brand ships by zone and loses customers in the zones where boxes arrive warm. A mobile game sees payer rates that differ by a factor of five between countries. Geography is a strong input to a model. As a segment on its own, it’s a map, and the map doesn’t change when a customer does.
Psychographic segmentation groups by attitudes, values and lifestyle, usually from surveys. It’s where “eco-conscious millennials” come from. It’s useful for creative and brand work, and almost useless for deciding who gets an offer this week, because you can’t survey two million people every Monday and the attitudes don’t predict the order gap anyway.
Which leaves behavioral segmentation, the one that matters for decisions. It gets its own section.
| Type | Groups by | Data it needs | Good for | Where it fails |
|---|---|---|---|---|
| Demographic | Age, income, life stage | Profile fields | Market sizing, creative | Two identical profiles behave differently |
| Geographic | Location, climate, zone | Address, device location | Pricing, logistics, local campaigns | Static; doesn’t move when the customer does |
| Psychographic | Attitudes, values, lifestyle | Surveys, panels | Brand and creative strategy | Can’t be refreshed at scale; doesn’t predict action |
| Behavioral | Purchases, sessions, engagement | Transaction and event history | Lifecycle and promo decisions | Describes the past; late on anything that just changed |
Behavioral segmentation
Behavioral segmentation groups customers by what they’ve done with you: how often they buy, what categories they buy from, how they engage with email and the app, whether they use the loyalty program, how they respond to discounts. It’s built from the same transaction and event history a model would use, which is why it’s the strongest classic method and also why it’s the one that gets replaced first.
In ecommerce, behavioral segments look like “bought from two or more categories in the last 90 days” or “only ever purchases on promotion.” In subscription, they’re “skipped two of the last four deliveries” or “has never changed their plan.” In gaming, “played five or more sessions in the first week” versus “one session, never returned.” In fintech, “direct deposit active” versus “card used once in 60 days.” Each one is a sensible rule, written by someone who understood the business, and each one is a snapshot that was true on the day it was written.
Scale is where these rules break down. Teams accumulate hundreds of these rules, overlapping, half of them orphaned from the campaign they were built for. Nobody can say which segment a given customer is in today without running the query. The customer whose behavior shifted last week, the one the business most needs to notice, is the one a static behavioral segment is slowest to pick up. If you want the longer treatment of how to read behavior before you segment on it, our guide to customer behavior analysis covers the models and the data.
RFM analysis, worked
RFM analysis scores every customer on three questions: how recently they purchased (recency), how often they purchase (frequency), and how much they spend (monetary). Each gets a score from 1 to 5, usually by quintile, and the three digits together place the customer in a named segment. It takes a spreadsheet and an afternoon, which is why it has survived for decades.
Here it is for six customers of a direct-to-consumer coffee brand, scored on the last twelve months. The numbers are illustrative, but the pattern is one we see in every RFM table.
| Customer | Last order | Orders (12 months) | Spend (12 months) | R | F | M | RFM | Classic label |
|---|---|---|---|---|---|---|---|---|
| Maya | 6 days ago | 14 | $620 | 5 | 5 | 5 | 555 | Champion |
| Theo | 19 days ago | 9 | $410 | 4 | 4 | 4 | 444 | Loyal |
| Priya | 71 days ago | 11 | $530 | 2 | 5 | 5 | 255 | At risk |
| Jonah | 4 days ago | 1 | $38 | 5 | 1 | 1 | 511 | New |
| Lena | 140 days ago | 3 | $95 | 1 | 2 | 2 | 122 | Hibernating |
| Sam | 33 days ago | 5 | $1,150 | 3 | 3 | 5 | 335 | Big spender, cooling |
From those labels, the standard playbook writes itself. Champions get early access and no discounts. Loyal customers get the referral program. At-risk customers get a win-back offer. New customers get the onboarding series. Hibernating customers get one last reactivation email and then suppression. Big spenders who are cooling get a personal note.
Reasonable, as first sorts go, and if your team has never segmented at all, start here. It will outperform a blast to everyone. Then read the next section before you build a budget on it.
Where RFM breaks
Look at Priya and Theo again. RFM calls Priya “at risk” because her last order was 71 days ago, which puts her in the bottom recency quintile. Priya orders every 60 days. She’s eleven days late, which for a two-pound coffee bag is a long weekend. Theo orders every 14 days and is now at 19. He’s the one whose rhythm actually broke, and RFM calls him loyal.
That’s the first failure: RFM measures position, never trajectory. A 71-day gap means something completely different for coffee and for mattresses, and it means something different for every customer inside the coffee brand too. The “at risk” label is defined by a recency rule, which means by the time a customer earns it, they are already late by construction. The model that would have caught Theo needed to compare his current gap to his own history, and RFM has no column for that.
Jonah is the second failure. One order, $38, four days ago. RFM scores him 511 and calls him new, which tells you nothing about whether he becomes Maya or Lena. His first order was a single-origin sampler, he opened every onboarding email, and he came in through a podcast ad rather than a 40%-off coupon. Those are the signals that separate a future champion from a one-time buyer, and a scoring model trained on your history would weigh them. RFM can’t see them.
Sam is the third. High spend, cooling frequency, and no way to tell whether he’s stocking up less often because he bought a grinder and is drinking better coffee more slowly (fine) or because he found another roaster (not fine). RFM says what he did. It has no opinion on what he’ll do, and no opinion at all on whether a message would change it.

Clustering has the same limit in a nicer outfit. A k-means model will find natural groups in your customer base without anyone defining the rules, which makes it a good exploratory tool and a great way to discover a segment you didn’t know you had. It still describes similarity today. It does not score what any customer in the cluster will do next month.
Look-alike modeling, where you hand an ad platform a seed audience of your best customers and ask for more people like them, is RFM pointed outward. It works about as well as the seed, and a seed built from a “champions” segment is a seed built from the past. The brands getting the most out of look-alikes now feed the platforms predicted value instead, which is the subject of the value based bidding chapter in our lifecycle playbook.
Predictive segments
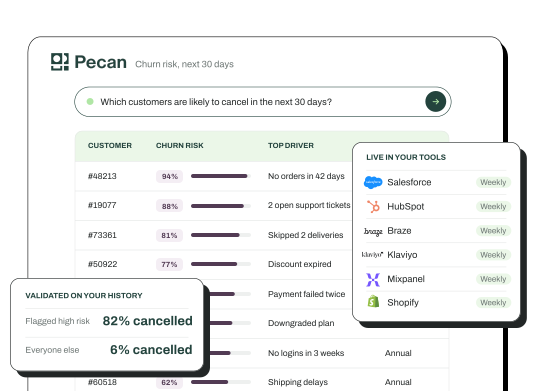
A predictive segment is defined by a predicted behavior rather than a past one: customers who will churn in the next 60 days, customers who will buy from the fall collection in the next 30, customers who will respond to a reactivation offer. The membership comes from a model trained on your own history, every customer gets scored, and the segment recomputes every night as behavior changes.
Now the same six coffee customers, scored for the future instead of the past. The scores are illustrative.
| Customer | Classic RFM label | Will churn in 60 days | Will buy in 30 days | Will respond to a 15% offer | Predictive segment |
|---|---|---|---|---|---|
| Maya | Champion | 0.04 | 0.96 | 0.02 | Leave alone; no offers |
| Theo | Loyal | 0.71 | 0.31 | 0.58 | At-risk persuadable; act now |
| Priya | At risk | 0.12 | 0.84 | 0.05 | Fine; the gap is normal for her |
| Jonah | New | 0.22 | 0.66 | 0.19 | Likely regular; standard onboarding |
| Lena | Hibernating | 0.93 | 0.03 | 0.04 | Gone; suppress from paid |
| Sam | Big spender, cooling | 0.38 | 0.55 | 0.41 | Watch; content, no discount yet |
Three things changed. Theo moved from “loyal, no action” to the top of the retention list, because the model compared his 19-day gap to his own 14-day rhythm and his falling email opens. Priya moved out of the at-risk group entirely; the win-back offer RFM would have sent her was a 15% discount to someone who was reordering on Thursday anyway. Lena, who RFM would have kept in paid retargeting for another quarter, got suppressed, which is the cheapest decision on the table.
Notice too that the predictive segment is made of three scores. Churn propensity says who is leaving, purchase propensity says who is buying, response propensity starts to say whether a message changes anything. That last column is the bridge to the rest of the ladder, and the propensity modeling chapter explains how each score gets built.
Predictive segments also replace the segment library. Instead of 300 overlapping rules, a mature B2C program runs a handful of models (churn, purchase by category, response, value) and every segment anyone needs is a filter on those scores. “High value, at risk, persuadable” is one query, and it’s different tomorrow because the customers are. For the same reason, the right way to check whether a segment is working is a cohort view over time, the method we cover in the churn and retention playbook’s measurement chapter: does the group you defined actually behave differently from the base, and does the difference hold?

Consider two B2C examples of segments built this way. Little Spoon, a baby food subscription, uses predictive lifetime value to guide where acquisition spend and retention effort go, which is a value segment defined before the customer has had time to earn it. A mobile game maker with over 5M downloads scored players for VIP potential instead of waiting for them to spend, and the model identified more than 200% additional potential “high rollers” or VIP players compared with the rules the studio had been using. Those players were sitting in the “new” and “casual” segments of an RFM-style grid, invisible until the model looked at trajectory instead of position.
From segments to decisions
Even a predictive segment is still a group, and the point of this playbook is that the best decisions get made one customer at a time. The segment is where you start because it’s where your team already lives: every ESP, CRM and ad platform speaks segments, and a predictive segment drops into those tools as a field or an audience with no retraining of the people who use them.
Two more rungs refine it. Propensity turns the segment into a ranked list, so a retention budget for 20,000 goes to the 20,000 who need it most. Uplift answers the question none of the segments above can: would the offer change anything? Theo at 0.58 response probability is worth the 15% discount. Sam at 0.41 might be worth a content email and a second look next week. Maya at 0.02 would take the discount, say thank you, and buy exactly what she was going to buy anyway. The uplift modeling chapter is where that budget gets rescued.
If you’d rather see the whole arc first, the lifecycle marketing playbook shows how a predictive segment feeds every stage from acquisition to win-back.
Where we come in
Building the models behind predictive segments used to be the reason teams stayed on RFM. In one sentence: you bring your historical customer data and the behavior you want to segment on, the Predictive AI Agent reads that data as it is, trains and validates the churn, purchase and response models, and we own the outcome, with scores live as segments and fields in the ESP, CRM and ad platforms your team already uses. From there, the segment library shrinks to a handful of models and every segment refreshes itself.
Predict the right move for every customer:
Book a demoFAQ
What is RFM analysis?
RFM analysis scores each customer on recency (how recently they bought), frequency (how often they buy) and monetary value (how much they spend), usually from 1 to 5 on each, and groups customers by the combined score into segments such as champions, loyal, at risk and hibernating. It’s quick to build and describes past behavior well. It can’t see trajectory, so it’s late on customers whose rhythm just changed.
What is the difference between behavioral and demographic segmentation?
Demographic segmentation groups customers by who they are (age, income, life stage). Behavioral segmentation groups them by what they’ve done with your brand (purchases, sessions, engagement, promo use). Behavioral segments predict action far better than demographic ones because they’re built from the same history a predictive model uses, but both describe the past.
How many customer segments should a B2C brand have?
Fewer than it has now. A mature predictive program runs a handful of models (churn, purchase by category, response, value) and treats every segment as a filter on those scores, refreshed nightly. Most brands can retire a library of hundreds of static segments once three or four predictive ones are live.