Playbook
The B2C Churn and Retention Playbook
Every customer churn number you report was measured after the customer had already decided to leave. That’s the whole problem with how most B2C brands run retention, and it’s the reason this playbook exists.
We wrote it for brands with large customer bases: hundreds of thousands or millions of subscribers, shoppers, players, account holders or policyholders. At that scale, the customer makes up their mind weeks before anything shows up in a dashboard. The subscriber who will cancel next month has already stopped opening your emails. The shopper who won’t reorder has already let the gap between purchases stretch. The player who’s about to lapse has already shortened their sessions. Your churn report arrives after all of it.
We call that stretch of time the decision gap: the weeks between a customer quietly deciding to go and your team finding out. Retention at scale is the discipline of working inside that gap. Everything in this playbook is organized around it: measure the leak with numbers you can trust, predict who is in the gap right now, act while there’s still something to act on, win back the few who are worth it, and prove the whole thing with a holdout so nobody is paying for “saves” that would have happened anyway.
If you run a small business with a few thousand customers, most of this will be overkill. Everyone else, read on.

The chapters
- 1. Measure: churn rate, retention rate and what good looks like.The formulas, the benchmarks by industry, and cohort analysis with a worked example.How to calculate churn rateRetention rate: the formula and the trapWhat good looks like: churn and retention benchmarks by B2C industryCohort analysis for retentionDefining churn when nobody cancels
- 2. Predict: how churn models find at-risk customers early.Framing the question, the data that carries the signal, lead time, thresholds and explanations.Framing the question: who, by when, defined howThe data that carries the signalLead time beats accuracyFrom a score to a list: thresholds, capacity and explanationsCommon ways churn models go wrongWhat churn prediction looks like by industry
- 3. Prevent: retention strategies by industry.One play per industry, and who to aim it at.The menu: six retention actions that scaleEcommerce: fight silenceSubscription and streaming: fight the cancel clickGaming: fight day fourFintech: fight the loss of primary statusInsurance: fight the shopping windowAiming the strategy: at-risk and persuadableCustomer retention strategies that don’t scale
- 4. Win back: reactivation campaigns that pay off.Defining lapsed, timing the return window, sizing the offer.Defining lapsed by industryThe three groups, and why blasting all three loses moneyTiming: the return windowThe offer: size it to the predictionChannels and suppressionMeasuring a win-back campaign
- 5. Prove it: measuring retention lift with incrementality.Holdouts that protect the budget.Why save rate liesHow to set up a retention holdoutHow big does the holdout need to beReading the resultLift by segment and by actionHoldouts people argue aboutWhere to go from here
Why retention is the cheapest growth lever B2C brands have
The arithmetic is unforgiving, so let’s do it with real-looking numbers.
Picture a subscription brand with one million active subscribers and 6% monthly churn. That’s 60,000 cancellations every month. To keep the base flat, acquisition has to bring in 60,000 new subscribers a month, 720,000 a year. At a $60 blended acquisition cost, the brand spends $43.2 million a year just to stand still. Growth starts at dollar 43,200,001.
Now cut monthly churn from 6% to 5.4%, a 10% relative improvement that a well-run retention program can reach. That’s 6,000 fewer departures a month, 72,000 a year, and $4.3 million of acquisition spend the brand no longer needs to replace them. Add the revenue those 72,000 subscribers keep paying, and retention has outperformed any single acquisition channel the brand runs, at a fraction of the media budget.
The same logic holds for an ecommerce brand measuring repeat purchase rate, a game studio watching day-30 retention, a neobank tracking primary-account status, or an insurer looking at renewal rates. Your customer retention rate is the one number that compounds. Every point you hold on to is a point you don’t have to buy again next quarter.
So why do most brands still spend far more on acquiring customers than on keeping them? Partly habit. Mostly because retention has felt unmeasurable and unpredictable. This playbook fixes both.
Step 1: Measure churn the right way
Before you can shrink churn, you need a number you trust, and most churn rates don’t deserve it.
The simple churn rate (customers lost in a period divided by customers at the start of it) breaks the moment a brand grows. New customers flood the denominator, the rate looks like it’s improving, and nobody notices that the cohort you acquired in March is evaporating. A growing brand can report a falling churn rate while losing more customers every month. We’ve watched it happen.
The fix is to measure churn by cohort: group customers by when they started, follow each group over time, and compare the curves. Cohort analysis tells you whether the brand is getting better at keeping people or just better at finding new ones. It’s also where you discover that most of the leak happens in the first 90 days, which changes where you spend.
Pick one definition of a churned customer per business line and write it down. For a subscription, it’s a cancellation or a failed renewal. For ecommerce, where nobody cancels, it’s a purchase gap longer than the category’s normal buying cycle. For gaming, it’s inactivity over a window that depends on the genre. The chapter on churn rate, retention rate and what good looks like covers the formulas, the benchmarks by industry, and a worked cohort example you can copy into a spreadsheet.

Step 2: Predict churn before it happens
Measurement tells you how big the leak is. It can’t tell you who to call tomorrow.
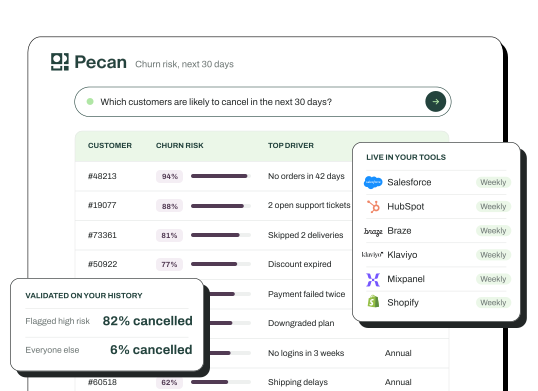
That’s the job of a churn prediction model: it reads each customer’s recent behavior (order gaps, session length, support contacts, payment events, app opens, whatever your historical data holds) and scores how likely each one is to churn inside a window you choose, say the next 60 days. The output is a ranked list, refreshed daily or weekly, with the reasons behind each score.
Two things make or break the model, and neither is accuracy. The first is lead time. A model that flags the subscriber the day before they cancel is a very accurate obituary. You want a window long enough to change someone’s mind, which usually means predicting 30 to 90 days out and accepting a little less precision in exchange. The second is explanation. A score of 0.87 is a number; “0.87 because session frequency dropped 60% and the last two purchases were discounted” is an action.
This is also where the decision gap closes. A good model identifies the subscriber whose behavior shifted three weeks ago, long before the cancel button gets pressed. Our chapter on how churn models find at-risk customers early walks through how the prediction question gets framed, what data it needs, and how to set a threshold that matches your team’s capacity to act. If you’d rather see what the output looks like first, our churn prediction software page shows the scores, the explanations and where they land.
Step 3: Retention strategies that work at scale
Loyalty programs, better onboarding, surveys, faster support. You’ve read that list before. Those tactics work, and they work on everyone equally, which at scale means they’re expensive and impossible to attribute.
Retention at scale is a targeting problem: who gets which action, and when. A customer retention strategy that works for a million customers is a short menu of actions (a pause option, a plan change, a replenishment reminder, a win-the-week bonus, a proactive rate review) matched to the customers who are both at risk and likely to respond. Everyone else gets left alone, which is cheaper and, frankly, more respectful.
The industry matters more than the tactic. A streaming service fights cancellation; an ecommerce brand fights silence; a game studio fights the fourth day; a neobank fights the moment a paycheck moves elsewhere; an insurer fights a 30-day shopping window before renewal. The chapter on retention strategies by industry gives a specific play for each, and shows which customers each play should be aimed at.
One rule holds across all of them: never aim a discount at a customer who would have stayed anyway. That’s where most retention budgets quietly disappear.

Step 4: Win back the customers worth winning back
Some customers leave anyway. A win-back campaign exists for them, and it’s the one lifecycle program where ignoring most of the list is the right strategy.
Lapsed customers fall into three groups. A small group will come back on their own (they moved, they got busy, they’ll be back when the season turns). A larger group will never come back, and no offer changes that. The group in the middle will return if you reach them with the right message in the right window. Blasting all three with a 30% off coupon pays the first group for nothing, wastes money on the second, and under-serves the third.
The job is to predict which lapsed customers belong in the middle group, reach them inside their return window (which, like everything else here, varies by industry) and measure the result against a holdout. Our chapter on reactivation campaigns that pay off covers how to define “lapsed” for each business, how to time the campaign, and how to size the offer.
Step 5: Prove the lift with a holdout
Here’s a sentence that makes retention teams wince: most of the customers your program “saved” were never leaving.
It happens whenever a program measures itself by counting people who received a retention action and then stayed. Many of them would have stayed without it. The only way to know how many is a holdout: a randomly selected group of at-risk customers who get no action at all, so you can compare their retention to the treated group. The difference is your lift. Everything else is a vanity metric.
Holdouts feel wasteful to teams under pressure to hit a number. In practice, they’re the thing that protects the budget, because they turn “we ran a program” into “we kept 4,100 subscribers we would otherwise have lost, and here’s the control group that proves it.” The chapter on measuring retention lift with incrementality covers holdout size, duration and how to read the result. For the measurement principle itself, our explainer on incrementality is a good primer.

Churn analysis vs churn prediction: what each tells you
Teams use these two terms interchangeably, and the confusion costs them. They answer different questions.
| Churn analysis | Churn prediction | |
|---|---|---|
| The question | Why did customers leave? | Which customers will leave next, and why? |
| Direction | Backward, over past periods | Forward, over the next 30 to 90 days |
| Unit of work | Cohorts, segments, exit reasons | Individual customers, each with a score |
| Output | A report or dashboard, updated monthly | A ranked list, refreshed daily or weekly, with drivers |
| Who uses it | Analytics, finance, product | Lifecycle, CRM, retention and support teams |
| What it changes | Pricing, onboarding, product gaps | Who gets which action this week |
| When you can act | After the fact | Inside the decision gap |
Churn analysis is where you learn that customers acquired through a particular discount channel churn at twice the rate of organic ones, or that most cancellations cite price in the exit survey. It’s essential, and it’s slow. Churn prediction takes what analysis taught you about the past and applies it to every customer in the base today. You need both. You act on one.
How churn looks different by industry
Churn is the same word for five different behaviors, and a playbook that treats them as one will fail in four of them.
In ecommerce, nobody cancels. Customers go quiet, and the gap between purchases stretches until one day it’s permanent. Churn here is defined by the category’s buying cycle: a coffee subscriber who skips 45 days is at risk, a mattress buyer who skips four years is normal. Repeat purchase rate and the time between orders carry the signal.
Subscription businesses (streaming, meal kits, memberships) get an explicit churn event, which makes it easier to count and easier to predict. A large share of it is involuntary, from failed payments and expired cards, and that slice responds to dunning logic rather than marketing. Voluntary churn shows up weeks ahead in declining usage, skipped deliveries and an uptick in visits to the account page.
Gaming has the shortest window of all. A mobile player who doesn’t return by day seven is usually gone, so retention gets measured at day 1, day 7 and day 30, and the model has to predict in days, not months. The economics are lopsided too: keeping one paying player can be worth hundreds of non-payers.
Fintech accounts rarely close. They go dormant. The real churn event is losing primary status: the paycheck moves to another bank, the card slips from the top of the wallet, the balance drifts to zero. None of that triggers a cancellation, so you have to predict it from transaction patterns.
Insurance ties churn to the renewal date, but the decision gets made during the shopping window before it, often triggered by a rate change. The signal lives in quote requests, policy document downloads and service calls in the 60 days before renewal.

What this looks like in practice
Three retention teams, three different churn events, one playbook.
Whistle Express sells monthly car wash plans, and its data team of three people had never shipped a machine learning model (building one would have taken “anywhere from 8 to 12 months,” in their data engineer’s words). They framed the question tightly: two weeks after a member recharges, will that member fail to renew in the next month? Whistle Express had its first churn predictions in 2 weeks and a production model in under 2 months, and reduced churn by 30% in new markets.
Clearwave Fiber, an internet provider, went from no predictive analytics to live churn predictions in 2 months, with the model itself built in 4 weeks. The part we’d point any retention lead to is how they measured it. For the customers predicted to be at the greatest risk of churn (approximately the top 1%), Clearwave compared treated and untreated customers: a treated churn rate of 1.2% to 1.5% against an untreated churn rate of around 40%, which the team describes as 20x lower churn in the highest-risk segment. That’s Step 5 in one sentence.
The Credit Pros, a fintech, used to take about three months to develop a churn model. The Credit Pros now predicts whether a client will churn 30 days after a specific date, with a production-ready model built in two to three weeks, and their data analyst credits the approach with increasing revenue by retaining clients longer.
Three industries, three definitions of churn, and in each case the work started with measuring the leak and framing one prediction question.
How we help
Everything above works with any prediction layer. Here’s ours, in one sentence: you bring your historical customer data and the question (“who will churn in the next 60 days?”), the Predictive AI Agent reads that data as it is, trains and validates the churn model, and we own the outcome, with scores and explanations live in the CRM, ESP or warehouse your retention team already uses.
From there, the playbook runs the way it’s written: a ranked list every week, actions aimed at the customers who are both at risk and reachable, a holdout that proves the lift, and a model that stays accurate as your customers change. When churn is under control, the same setup answers the next question, usually who will buy more or who will come back.
See who will churn in the next 60 days:
Book a demoFAQ
How do I calculate the churn rate of a company?
Divide the number of customers lost during a period by the number of customers you had at the start of that period, then multiply by 100. If you started October with 500,000 subscribers and 20,000 cancelled during the month, churn is 20,000 / 500,000 = 4% monthly. Leave customers acquired during the period out of the denominator, or growth will flatter the number. For a more honest view, calculate it by acquisition cohort.
Is a 5% churn rate good?
It depends entirely on the period. 5% annual churn is excellent for almost any consumer business. 5% monthly churn compounds to about 46% of your base lost over a year, which is typical for many subscription businesses and far too high for a bank or an insurer. Always state churn with its period, and compare it to your own cohorts before comparing it to anyone else’s benchmark.
Is 90% customer retention good?
90% annual retention (10% annual churn) is strong for subscription, telecom and insurance businesses. 90% monthly retention means you keep only about 28% of a cohort after twelve months, which is a serious leak for anything but a short-cycle app. As with churn, the period makes the number.
How do you keep customers coming back?
At scale, by knowing which customers are at risk before they leave and aiming the right action at them: a pause instead of a cancel, a reminder timed to their buying cycle, a plan that fits their usage, a reason to return on day four. The tactics are old. The targeting is what’s new, and it’s what makes them pay.