The B2C Churn and Retention Playbook > Chapter 2: Predict
Predict: how churn models find at-risk customers early
A churn model is worth exactly the time it buys you. Teams that build one tend to optimize for accuracy first, and accuracy is the wrong thing to optimize first. A model that flags a subscriber the day before she cancels can be 95% right and completely useless, because there’s no time left to do anything with it. Lead time and actionability come first. Accuracy comes third.
Churn prediction, in plain terms, uses a model trained on your own historical customer data to score how likely each customer is to leave within a window you choose, and to say why. The output is a ranked list of at-risk customers, refreshed daily or weekly, with the driver next to each score. This chapter covers how to frame the question so the model is useful, which data carries the signal, why a longer window beats a sharper one, and how a score becomes a list your team can work on Monday.
Framing the question: who, by when, defined how
Every churn prediction model answers one question, and the question has three parts.
Who is eligible. Active subscribers. Customers with at least one order in the last 180 days. Players active in the last seven days. Policyholders with a renewal in the next 90 days. The population decides what “churn” can even mean, so pick it deliberately.
By when. This is the prediction window. “Will this customer churn in the next 60 days?” is a different model from “in the next 7 days,” trained on different examples and useful for different things. Most B2C retention programs land between 30 and 90 days, long enough to act, short enough that behavior still predicts the outcome.
Defined how. The label is whatever you decided a churned customer is in Chapter 1: a cancellation, a failed renewal, a purchase gap past the category’s rhythm, 14 days of inactivity, a balance below a floor. The model learns from your history of that exact event, so if the definition is fuzzy, the predictions will be too.
The best framings we’ve seen are almost boringly specific. Whistle Express, which sells monthly car wash plans, framed theirs as whether a member, two weeks after a recharge, would fail to renew in the next month. The Credit Pros, a fintech, predicts “whether a client will churn 30 days after a specific date.” A global direct-to-consumer beverage subscription company targeted high-risk customers as far as 3 months in advance. Each of those is a sentence a retention manager can act on, and each one fixes the window before anyone touches a model.
The data that carries the signal
Behavior carries the signal. Demographics tell you who a customer is; behavior tells you what they’re about to do, and for churn the behavioral signals are the ones that move weeks before the event.
| Signal | What it looks like | Where it matters most |
|---|---|---|
| Purchase or order gap | Days since last order compared with the customer’s own rhythm | Ecommerce, DTC subscriptions |
| Session frequency and length | Weekly opens, minutes per session, trend over four weeks | Streaming, gaming, fintech apps |
| Feature or content usage | Share of the catalog used, recipes rated, levels played, features touched | Subscription, gaming |
| Delivery and plan events | Skipped deliveries, downgrades, pause requests, visits to the account page | Meal kits, memberships, streaming |
| Payment events | Failed charges, expiring cards, switched payment method | Every subscription business |
| Support contacts | Tickets, chat sessions, complaint categories in the last 30 days | Telecom, fintech, insurance |
| Promo dependence | Share of orders bought on discount, time since last full-price order | Ecommerce, subscription |
| Primary-status signals | Direct deposit present, card used in the last 30 days, balance trend | Fintech, banking |
| Renewal-window activity | Quote requests, document downloads, service calls in the 60 days before renewal | Insurance |
Notice what’s missing: survey responses and NPS. They help explain churn after the fact. They rarely predict it, because the customers who answer surveys are the engaged ones.
Two practical notes. First, the model needs the history of these signals as they stood at the moment of each past prediction. If you’re scoring customers 60 days before they left, the model must learn from what you knew 60 days before, which is why the data preparation matters more than the algorithm. Second, messy is fine. Real order tables have gaps, duplicate IDs and a column someone renamed in 2023. A model trained on historical data as it is will find the pattern anyway, and the pattern is what you want.

Lead time beats accuracy
Here’s the trade-off every churn model makes, and the one most teams get backwards.
Predict closer to the cancellation and the model gets more accurate, because the signals are louder. A subscriber who visited the cancel page three times yesterday is easy to flag. The further out you predict, the quieter the signals and the lower the precision, but the more time your team has, and the more of those customers are still persuadable.
Put illustrative numbers on it. A subscription brand has one million subscribers and loses 4% a month.
Model A predicts churn 7 days out. It flags 10,000 subscribers a month at 92% precision, so 9,200 of them really are about to leave. With a week of runway, a retention action reaches maybe 10% of them in time to change anything. That’s 920 saves.
The second model, B, predicts 60 days out. It flags 30,000 subscribers at 78% precision, so 23,400 real at-risk customers. With two months to work, the team can reach most of them, and a quarter respond. That’s 5,850 saves, from a “worse” model.
Model B is six times more valuable, and it would lose a bake-off on every accuracy metric. Judge a churn model by saves per month inside a window you can act in. The score on the slide is a tiebreaker. The beverage subscription company above identified 85% of customer churn in advance and saw an 11% overall reduction in subscription churn by building campaigns 1, 3 and 6 months out. The lead time was the product.

From a score to a list: thresholds, capacity and explanations
Every churn model produces a probability for every customer, from 0 to 1. Nobody acts on a probability. They act on a list, and turning one into the other takes three decisions.
Where to draw the line. Rank every customer by score and cut where your team’s capacity runs out. If the call center can handle 2,000 conversations a week, the threshold is whatever score the 2,000th customer has, and it moves as the scores do. If the action is an automated email, the line can sit much lower. Set the threshold from capacity, then check the precision at that line.
How often to refresh. Weekly is the floor for most subscription and ecommerce businesses. Daily for gaming and fintech, where the window is short. A score that’s a month old describes a customer who has since done thirty more days of things.
What travels with the score. A bare 0.74 goes nowhere. “0.74, because weekly app opens fell from six to one and the last delivery was skipped” tells a lifecycle marketer which journey to put this customer in. Every score should carry its top two or three drivers, in plain words, into the CRM or ESP where the action happens. The lifecycle team’s chapter on churn risk scoring covers what happens once it lands there.
One more thing the score should carry: a date. “Predicted to churn by December 14” is a deadline. “At risk” is a mood.

Common ways churn models go wrong
Most failed churn models fail the same five ways, and none of them is the algorithm.
Leakage. The model is handed a feature that only exists because the customer already churned: the cancellation email, the exit survey, the final refund. It scores beautifully in testing and knows nothing. Every feature has to be something you knew before the window opened; our help center has a short piece on what data leakage is and how to prevent it.
Voluntary only. A model trained only on customers who chose to cancel will miss the ones whose card expired. Involuntary churn is a large share of subscription churn, and it has its own, very predictable signals (card expiry dates, past failed charges). Either train on both with a flag, or build a second model and route those customers to payment recovery instead of a save offer.
Never retrained. Customer behavior drifts: a price change, a new competitor, a redesign of the app. A model trained on 2024 behavior scores 2026 customers with 2024 assumptions. Retrain on a schedule and watch the precision at your threshold; when it slides, the model is telling you the world moved.
Accuracy on the whole base. 96% of customers won’t churn this month, so a model that predicts “no churn” for everyone is 96% accurate. Measure the model where you use it: precision and lift in the top-scored group you actually contact.
Built for the data team. A model that lives in a notebook and gets run when someone remembers is a research project. The score has to arrive in the tool where the retention team works, on a schedule, with the drivers attached, or the decision gap stays exactly as wide as it was.
What churn prediction looks like by industry
Mechanically, churn prediction is identical across B2C. The window, the label and the first action differ.
For a streaming service, the model predicts cancellation 45 days out from viewing frequency, content breadth and visits to the plan page, and routes price-driven risk to a plan-change offer and engagement-driven risk to recommendations.
Ecommerce brands predict a purchase gap past the category rhythm, 60 days out, from order cadence, promo dependence and browse activity, and time a replenishment reminder to each customer’s own cycle.
Mobile games work in days: day-7 lapse predicted from day-2 session depth, level progression and friends still active, with an intervention inside 48 hours that gives the player a reason to return.
A neobank’s model predicts loss of primary status 90 days out from direct deposit changes, card usage decay and balance trend, and sends the persuadable ones a reason to move the paycheck back.
Insurers predict non-renewal 60 days before the date, from quote requests, document downloads and service calls, and start the renewal conversation before the shopping begins.
Chapter 3 covers what each of those actions looks like in retention strategies by industry, and who to aim them at.

Where we come in
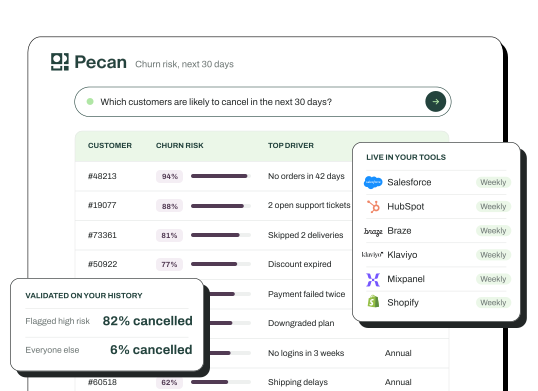
Everything above is true of any churn prediction model, however it gets built. Here’s ours, in one sentence: you bring your historical customer data and the question (“who will churn in the next 60 days?”), the Predictive AI Agent reads that data as it is, trains and validates the churn model with leakage checks built in, and we own the outcome, with scores, drivers and dates live in the CRM, ESP or warehouse your retention team already uses. The churn prediction software page shows the output; if you want the general mechanics first, our explainer on predictive modeling covers how these models are trained and validated.
See who will churn in the next 60 days:
Book a demoFAQ
How far in advance can churn be predicted?
For most B2C businesses, 30 to 90 days, which is the range where behavior still predicts the outcome and the team has time to act. Gaming and some apps predict in days because the lapse window is short. Longer windows trade a little precision for a lot more reachable customers, and that trade is almost always worth making.
How much data does a churn prediction model need?
Enough history of the churn event you defined to learn the patterns that precede it, which usually means at least a few thousand examples of customers who churned and the behavioral records (orders, sessions, payments, support contacts) from the months before they did. The data can be as messy as real data usually is, as long as it’s historical and joinable to a customer ID.
What’s the difference between a churn score and a churn segment?
A segment is a rule, such as “no order in 60 days,” that puts customers in a bucket after the behavior has happened. A churn score is a probability for each individual customer that they will leave inside a future window, updated as their behavior changes. Segments describe the past; scores rank the future.