Incrementality is the additional business outcome (sales, signups, installs, revenue) that a marketing activity caused, measured against what would have happened without it. It’s calculated by comparing a group exposed to the activity with a matched group that wasn’t, and isolating the difference.
No platform dashboard can report incrementality for you. Meta, Google, and TikTok can count the conversions they touched. They can’t count the conversions that would have happened had your ad never run, because measuring that requires a version of the world where it didn’t. That’s what incrementality is: the gap between what happened and what would have happened anyway. Everything in this guide follows from that one idea, including why controlled testing is the only honest way to get the number, and why modeling is the only practical way to keep it current across every channel.
What is incrementality?
The meaning of incrementality in marketing comes from a simple question: of all the sales you recorded this month, how many exist because of the campaign? Some customers were going to buy regardless. They’d already decided, or they searched for your brand by name, or they were on your email list and would have opened the next message anyway. A campaign that reaches those people gets credit in every attribution report and creates nothing new. Incrementality strips that credit out and leaves only the growth the activity caused.
Practitioners use a few related phrases. “Incremental value” is the extra revenue or conversions attributable to the activity. “Driving incrementality” means running marketing that produces outcomes which wouldn’t have happened on their own, as opposed to harvesting demand that already existed. “Incrementality measurement” is the set of methods (experiments and models) used to estimate the number.
This idea has become the center of marketing measurement for a practical reason: the alternatives have lost credibility. In the IAB’s State of Data 2026 report, published in February, up to 75% of buy-side decision-makers rated their attribution, incrementality, and mix modeling as underperforming. When every channel’s own reporting claims more credit than the business actually grew, a method that starts from “what would have happened anyway” is the only one that can settle the argument.

Key terms: incremental lift, iROAS, and cannibalization
Three terms come up in every serious incrementality conversation, and they’re worth pinning down before we get to methods.
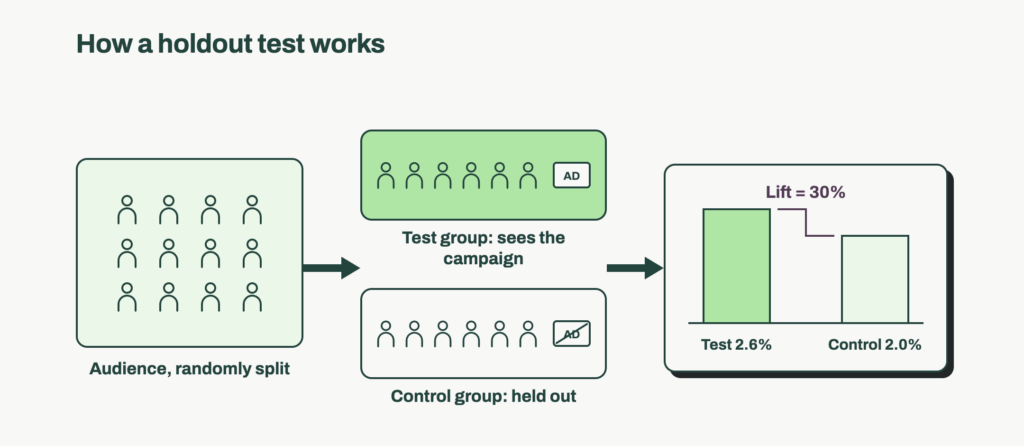
Incremental lift is the percentage increase in an outcome caused by the marketing activity, relative to the baseline that would have occurred without it. If a control group converts at 2.0% and an exposed group converts at 2.6%, lift is 30%. Lift is the headline number of every incrementality test, and it’s also what makes tests comparable across channels with different absolute conversion rates.
iROAS (incremental return on ad spend) is incremental revenue divided by the spend that produced it. Platform-reported ROAS divides all attributed revenue by spend, which includes revenue from customers who would have bought anyway. iROAS only counts the revenue the campaign caused, so it’s almost always lower than reported ROAS, sometimes dramatically. Teams that track blended efficiency alongside it often use marketing efficiency ratio (MER) as the top-line sanity check: if MER is flat while every channel reports rising ROAS, the extra ROAS isn’t incremental.
Cannibalization is the flip side of incrementality: when one activity’s conversions come at the expense of another’s, or of conversions that would have happened organically. Branded paid search cannibalizing organic clicks is the textbook case. A retargeting campaign that reaches people already about to complete a purchase is another. Cannibalized conversions show up as attributed wins and as zero incremental value, which is exactly the gap incrementality measurement is built to catch.
What is incrementality testing?
Incrementality testing is a controlled experiment that measures causal lift by splitting an audience into a group that receives the marketing activity and a group that doesn’t, then comparing outcomes. The exposed group is the test group; the withheld group is the control group or holdout. Because the two groups are comparable before the test starts, any difference in outcomes afterward can be attributed to the activity.
Most real-world needs are covered by three designs.
User-level holdouts. The audience is randomly split at the individual level. The control group is either shown nothing, shown a public-service or placeholder ad, or logged as a “ghost” impression the platform would have served but suppressed. Meta’s Conversion Lift and Google’s conversion lift studies work this way inside their own inventory. These tests are precise when the platform controls delivery, and they’re the standard for validating a single campaign or bidding strategy.
Geo lift tests. The split happens by geography instead of by person. You pick a set of test markets (cities, DMAs, states, or countries), run the activity there, and hold it back in matched control markets with similar historical trends. Outcomes are compared using matched-market or synthetic-control methods. Geo tests don’t depend on user identifiers, which is why they’ve become the default for measuring channels that platform holdouts can’t reach: TV, audio, out-of-home, and cross-platform campaigns. They also survive the identifier loss that has degraded user-level tracking since ATT.
Time-based or on/off tests. The activity is paused in a period and compared with a period when it ran. This is the weakest design because it can’t separate the activity from seasonality, competitor moves, or anything else that changed at the same time, but it’s sometimes the only option for a channel that can’t be split.
Two constraints decide whether a test is worth running. Sample size: the test needs enough conversions in both groups for the difference to be statistically significant, which rules out tiny campaigns. Duration: it must run long enough to capture delayed conversions, usually two to four weeks for direct response, longer for considered purchases. Google lowered the minimum budget for its incrementality tests to $5,000 in November 2025, which has widened access, but the company also reported that most advertisers run only one or two studies a year. That cadence is fine for a calibration check and far too slow for ongoing budget decisions, a point we’ll come back to.
How to measure incrementality, step by step
Here’s the sequence we use, with one worked example carried all the way through.
1. Define the outcome and the unit. Decide what you’re measuring (purchases, installs, revenue) and at what level (user, geo, or time period). The outcome should be the business result, not a platform proxy like clicks.
2. Split the audience or markets randomly. For a user-level test, randomize at the individual level so the two groups are statistically identical before exposure. For a geo test, choose control markets whose historical sales track the test markets closely.
3. Run the activity in the test group only. Keep everything else constant: same creative elsewhere, same promotions, same pricing. Any change that touches only the test group contaminates the result.
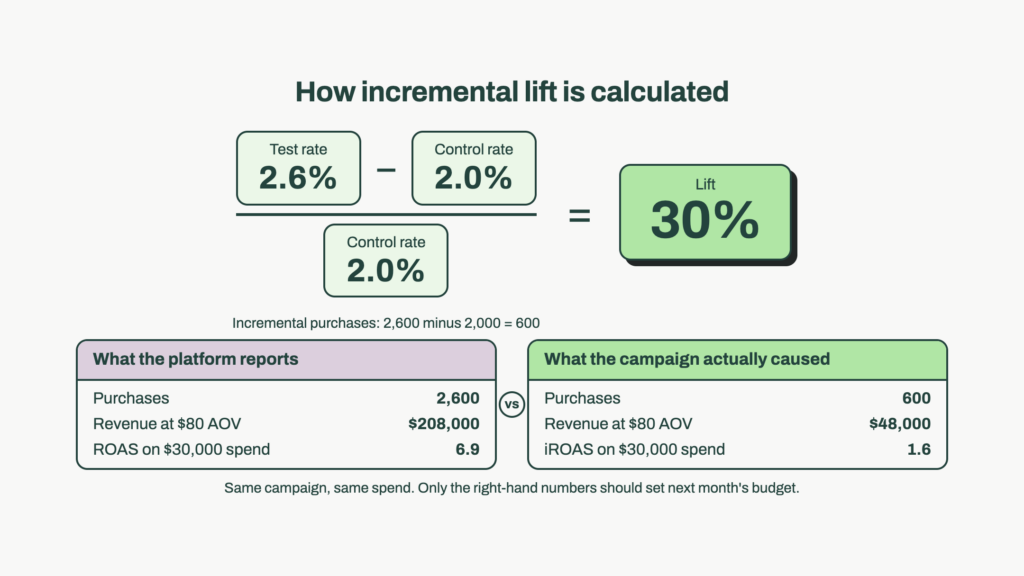
4. Compare conversion rates, not raw counts. Suppose you split 200,000 users evenly. Over four weeks, the test group produces 2,600 purchases (2.6%) and the control group 2,000 (2.0%). Because the groups are equal in size, incremental conversions are 600. If the groups were unequal you’d scale the control rate to the test group’s size first.
5. Calculate incremental lift. Lift = (test rate minus control rate) divided by control rate. Here that’s (2.6% minus 2.0%) divided by 2.0%, or 30%.
6. Translate lift into money. The test group cost $30,000 in media. With an average order value of $80, incremental revenue is 600 times $80, or $48,000, so iROAS is 1.6. Incremental cost per acquisition is $30,000 divided by 600, or $50. Now compare that with what the platform would have reported: 2,600 attributed purchases, $208,000 in attributed revenue, a reported ROAS of 6.9 and a reported CPA of $11.54. Both figures are technically true and both would lead you to overspend, because roughly three-quarters of the attributed purchases were going to happen anyway.
That gap between reported and incremental efficiency is the single most useful number a test produces. It tells you how much to discount the platform’s own reporting for that channel, and it rarely stays the same from one campaign type to the next. Mobile game publisher SciPlay, for instance, moved its retargeting from broad rule-based audiences to predictions of which lapsed players would actually respond, and then used the results for measuring the actual incrementality of retargeting. “That saves us a lot of time and effort around lift testing,” said Evyatar Livny, who leads marketing technology at SciPlay, “focusing on scaling the activity and the user journey itself, while also improving ROI.”

Incrementality vs attribution vs MMM
These three get lumped together as “measurement,” and they answer different questions.
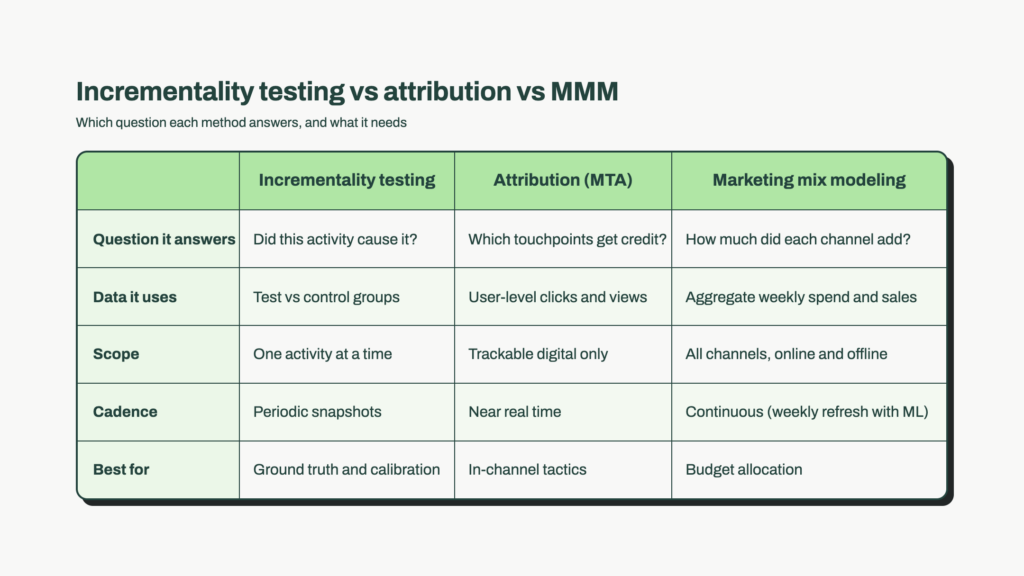
Attribution answers “which touchpoints were on the path to this conversion, and how should credit be split among them?” Multi-touch attribution (MTA) tracks individual users across clicks and impressions and assigns fractional credit under a rule (first-touch, last-touch, time-decay, data-driven). It’s fast, granular, and bottom-up. It also assumes it can see the user’s whole journey, which it increasingly can’t: Apple’s App Tracking Transparency, Safari and Firefox blocking third-party cookies by default, and walled gardens that only report their own conversions have all cut into the data MTA needs. Attribution assigns credit for what happened. It never asks what would have happened otherwise, so it can’t measure incrementality on its own. We compare the two head-on in our guide to MMM vs MTA.
Incrementality testing answers “did this specific activity cause additional outcomes?” It’s the only method that measures causation directly. The trade-offs are that each test covers one activity for one period, it needs enough volume to be significant, and it costs money in withheld exposure. Tests are ground truth, delivered in snapshots.
Marketing mix modeling answers “how much did each channel contribute to total outcomes, and how should the budget shift?” Marketing mix modeling uses aggregate, top-down data (weekly spend, impressions, sales, price, seasonality) and regression or Bayesian methods to estimate each channel’s incremental contribution, including offline channels and long-term effects. It needs no user-level data, so it isn’t affected by signal loss. Its historical weakness was speed: consulting-led MMM took months and refreshed quarterly.
What matters is how the three relate. Attribution is the tactical layer inside a channel. Incrementality tests are the periodic ground truth that tells you how much to trust everything else. MMM is the continuous, cross-channel estimate of incrementality, and it gets sharper every time a test result is fed back in to calibrate it. Teams that treat these as competing options end up either drowning in tests they can’t run often enough or trusting a model they never validated.
Acting on incrementality with AI-powered MMM
Cadence has always been the bottleneck. A geo test gives you a defensible lift number for one channel, once, and by the time you’ve run tests across six channels the first result is a quarter old. Budget decisions happen weekly. Something has to fill the gap between tests, and for most of MMM’s history that something was either a consultant’s quarterly deck or a marketer’s gut.
Machine learning changed the economics. Google open-sourced its Meridian MMM framework, added a no-code scenario planner in February 2026 and a geo-testing module in May, and folded the whole thing into Google Analytics 360. Meta built Robyn and, according to agency sources speaking to AdExchanger in July 2026, has since scaled that team back. The direction is clear either way: MMM has moved from a bespoke annual project to a continuously refreshed model that expects to be calibrated with real experiments.
That’s how we’ve built it at Pecan. Our Predictive AI Agent builds and validates a marketing mix model on your own historical data, including the messy parts, in one to three weeks rather than months, then refreshes it automatically (weekly for several customers) so the contribution estimates stay current. When you run an incrementality test, the result goes back into the model as a calibration point. One customer with a marketing budget above a billion dollars used our MMM across more than 20 channels, roughly 30% of it in linear TV and radio where user-level data doesn’t exist, and surfaced cost-cutting opportunities exceeding $100 million a year without giving up revenue. A mobile app’s UA team had its model live in three weeks and reduced its most popular app’s customer acquisition cost by 10% in the U.S. by reallocating across channels on the model’s incremental contribution estimates.
If your team can describe, in plain language, which channels it wants to compare and over what period, that’s enough to start. Book a demo and we’ll walk through how Pecan’s marketing mix modeling measures what your marketing actually causes, and how your existing lift tests can make it sharper.

What is the meaning of incrementality?
How do you measure incrementality?
What does it mean to drive incrementality?
What is incrementality testing?

Asaf is the Head of Customer Success at Pecan AI, where he helps enterprise customers turn predictive analytics into real, measurable business outcomes. He’s grown through Pecan from AI Success Manager to Team Lead to Director, bringing a strategic consulting background and an Economics degree from the Hebrew University of Jerusalem (plus a serious scuba diving habit).