AI supply chain optimization uses machine learning predictions to decide what to stock, what to make, what to ship, and what to buy. Models trained on your historical sales, inventory, and operations data forecast what’s coming, so decisions happen before problems do.
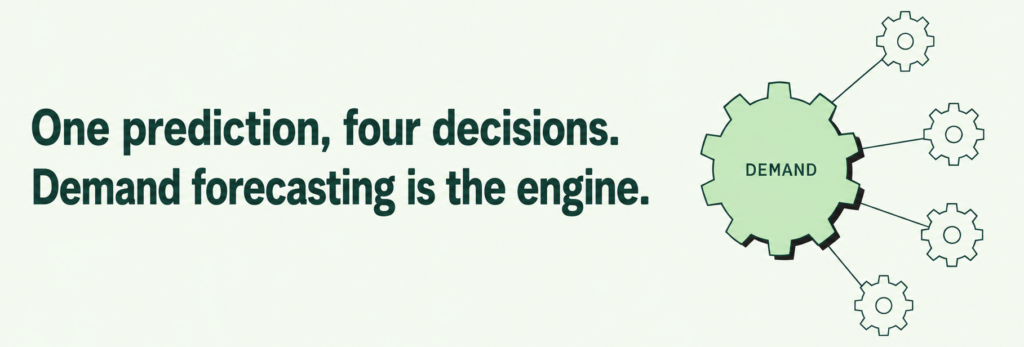
Here’s the framing that took us years of customer deployments to see clearly: this isn’t really five technologies. It’s one prediction, demand, feeding four decisions. Nearly every supply chain question (how much inventory, how much capacity, which shipments to group, which suppliers will slip) is a decision that becomes dramatically easier once you know what customers will want next month. That’s why we’ll cover five use cases below, but you should read the last four as consumers of the first:
- Demand forecasting
- Inventory optimization
- Capacity planning
- Shipping and delivery prediction
- Supplier performance
Every use case below comes with a real customer number, because the glossary pages ranking for these terms have plenty of definitions and zero evidence. We’d rather show you receipts.
What is AI supply chain optimization?
Traditional supply chain analytics explains what happened: last quarter’s stockouts, last month’s late shipments, yesterday’s inventory position. AI supply chain optimization moves the whole exercise forward in time. Machine learning models learn the patterns hiding in your transactional history (seasonality, promotion effects, regional quirks, supplier behavior, weather sensitivity) and produce forward-looking predictions specific enough to act on: units of this SKU, in this warehouse, next week.
The practical difference from the rules most supply chains run on today is granularity and adaptability. A reorder rule treats every product the same way forever. Predictive analytics in supply chain work treats every SKU, location, and week as its own question, and re-answers those questions as conditions change. When demand shifts, the rule keeps executing yesterday’s logic; the model notices.
An aggregate observation from our own supply chain deployments: customers almost always start with demand forecasting, whatever problem originally brought them in. Inventory pain, capacity pain, and shipping pain all trace upstream to the same root question, and once a reliable demand forecast exists, the downstream use cases follow quickly because they reuse the same data foundation. That pattern shaped how this guide is ordered.
Use case 1: Demand forecasting
Demand forecasting predicts how many units of each product customers will want, per location and time period. It’s deliberately the shortest section here, because it deserves its own dedicated treatment and it has one: forecast quality determines everything downstream, and getting to genuinely useful demand forecasting accuracy at the SKU level is a discipline of its own.
If demand forecasting is the problem you’re actually here to solve, that’s what DemandForecast.ai is for. It’s our dedicated demand forecasting platform, built on Pecan’s predictive engine and made for demand planners who need SKU-level forecasts with explainability and risk alerts, rather than the broader supply chain umbrella this page covers. Think of demand forecasting as the engine behind the other four use cases on this page: we’ll keep referring back to it, and readers who want to go deep should go there.
One number to anchor it: a Tier II high-tech manufacturer supplying some of the world’s largest OEMs went from unscientific projections to a fully trained, highly accurate demand forecast model in 14 days by unifying CRM, marketing, and raw ERP data in Pecan. Their understock had been extending manufacturing lead times while overstock burned labor and inventory cost, which is precisely the double-sided pain a forecast exists to prevent.
Use case 2: Inventory optimization
What it predicts: the stock level each SKU actually needs at each location to cover predicted demand plus uncertainty, instead of blanket safety-stock rules.
Data needed: sales history by SKU and location, current stock levels, lead times, and ideally promotions and returns. The forecast does the heavy lifting; predictive inventory management is largely the art of turning forecast plus lead time into buy quantities.
The real number: a fashion retailer working with Pecan saw forecasts help reduce overstock amounts by up to 50% while lifting sales 10 to 25%. That pairing matters. Anyone can cut overstock by understocking; cutting overstock while sales rise means inventory moved to where demand actually was. And at the extreme end of complexity, a grocery delivery app forecasting at the SKU level across more than 26 cities and 12,000+ suppliers used Pecan to get to market 10x faster than their in-house modeling efforts, reducing overstock instances by orders of magnitude and bringing stockouts to historic lows.

Use case 3: Capacity planning
What it predicts: the production, warehouse, and workforce capacity you’ll need in future periods, weeks to quarters out, so you commit to lines, shifts, and space before the crunch instead of during it.
Capacity planning is where forecast errors get expensive in both directions. Overbuild and you carry idle machines and underused staff; underbuild and you’re paying overtime, expediting freight, and missing commitments. Predictive capacity planning replaces the annual-budget-plus-gut-feel approach with rolling forecasts of load: expected order volume translated into machine hours, labor hours, and floor space per site. The same production planning forecasts that schedule what to make next week also, aggregated up, tell you what capacity to secure next quarter.
Data needed: order and production history, bills of materials or routing data that convert units into hours, plus calendars for planned downtime and seasonality. The high-tech manufacturer above is the working example here too: their forecast’s whole purpose was determining precise subcomponent quantities to manufacture, which is capacity planning at the component level.
Use case 4: Shipping and delivery prediction
What it predicts: two related things, depending on your business. For logistics teams, when a given shipment will actually arrive, based on lane, carrier, origin, and timing patterns. For e-commerce operators, which orders are worth holding or grouping, based on what the customer will do next.
That second version is less obvious and surprisingly lucrative. ShopTJC, the online arm of a global jewelry retailer, asked a single sharp question: after a customer buys, will they buy again within the next couple of days? When the model said yes, orders could be grouped into one shipment instead of shipping twice. That one prediction cut shipping costs by 6% without making everyone wait.
Data needed: order history with timestamps, customer purchase sequences, and for arrival-time prediction, shipment records with promised versus actual dates. Notice the pattern again: this is demand forecasting at the level of a single customer’s next 48 hours.
Use case 5: Supplier performance
What it predicts: which purchase orders and which suppliers are likely to arrive late, short, or out of spec, before the PO is even at risk.
Most procurement teams score suppliers retrospectively: quarterly reviews, on-time-in-full percentages, scorecards describing the past. A predictive approach flips it: given this supplier, this item, this quantity, this season, and this lead time, what’s the probability this specific order slips? Flagged orders get buffer stock, earlier follow-up, or a second source, and your safety stock stops being one-size-fits-all insurance against every supplier equally.
Data needed: PO history with promised and actual delivery dates, quantities ordered versus received, quality or rejection records, and item and supplier attributes. Even a couple of years of PO history is usually enough to separate reliably punctual suppliers from reliably optimistic ones.

Rules and ERP logic vs. predictive AI
If you already run SAP, NetSuite, or another ERP, the fair question is what a predictive layer adds that your existing logic doesn’t. The short answer: your ERP executes decisions brilliantly and makes them crudely. Here’s the honest comparison.
| Rules and ERP logic | Predictive AI | |
| How it decides | Fixed thresholds set by humans (reorder points, min/max, static safety stock) | Learned patterns from your own history, per SKU, location, and period |
| Reaction time | After the threshold is breached, i.e. after the problem | Before the event, on forecasted conditions |
| Handling of demand shifts | Rules stay wrong until someone notices and updates them | Models retrain on new data and adjust |
| Granularity | Same logic applied across broad categories | Individual predictions per SKU-location-week |
| Example | Reorder 500 units whenever stock drops below 200 | Order 730 units this week because a promo plus seasonal lift is predicted, 340 next week |
This isn’t a rip-and-replace argument. The predictive layer sits on top of the ERP: forecasts and risk scores flow into the same systems your planners already work in, and the ERP keeps executing. What changes is the quality of the numbers it executes.
How to start: a 5-step implementation plan
- Pick one use case with a number attached. Start where the pain is measurable: overstock dollars, expedite fees, stockout-driven lost sales. Demand forecasting is the most common entry point among our customers for the reason this whole article argues: everything else feeds off it. Sizing the pain also gives you the before/after math your CFO will ask for.
- Inventory your data (a checklist). You need transactional history, not perfection. Minimum viable: 18 to 24 months of sales or orders at the SKU-location level with dates and quantities; current inventory positions; product master data (category, price, launch date). Valuable extras: promotions calendar, lead times, PO history, returns. Owners are usually the ERP admin and the BI or analytics team, and pulling this is typically days of work, not months. Messy is fine; the preparation is exactly what modern platforms automate.
- Build the first model on real, recent data. Whether that’s an internal data science effort or a platform like ours, hold it to the same standard: validated on a time period it wasn’t trained on, benchmarked against your current method. With Pecan this stage runs in days; the tech manufacturer’s 14 days covered data connection through a fully trained model.
- Run it alongside the current process for one cycle. Let the forecast and the incumbent method both make their calls for a few weeks, then compare. This builds the planner trust that determines whether anything changes, because demand planning is ultimately a human workflow and a forecast nobody trusts is a spreadsheet tab nobody opens.
- Wire predictions into the decision, then expand. A forecast that lands in the ERP, the planning tool, or the replenishment workflow changes orders; one that lands in a slide deck changes nothing. Once the first use case pays, the adjacent ones (inventory, capacity, shipping, supplier) reuse the same connected data, which is why the second model always ships faster than the first.
Nanit, the smart baby monitor maker, is a good picture of the compounding effect: starting from sales forecasting, they improved forecast accuracy, cut time to insight, and gained clear visibility into what actually drives their demand, which then fed pricing strategy, a decision nobody would have listed under “supply chain” until the forecast made it better.
Want to see this on your own numbers? Book a demo and we’ll walk through what a demand or inventory model would look like on your operational data, typically live within days.

Will supply chain management be replaced by AI?
What is predictive analytics in supply chain?
What are examples of AI in supply chain optimization?
What data do you need for supply chain AI?