Here’s a number most finance teams never track: how old their current revenue forecast is.
Accuracy, sure. They’ll pull last quarter’s projection, line it up against what actually closed, and calculate the gap. That post-mortem lands the one week the forecast can’t change a single decision, because the quarter is already in the books. The hiring, the inventory, the spend, all committed against a number nobody can edit anymore.
I want to argue for a different yardstick. A forecast’s real accuracy is the accuracy of the version you’re looking at today, with everything that’s shifted since you built it either included or silently missing. A sharp model built in January and left alone is, by March, a guess in a clean shirt. The math didn’t get worse. The world moved, and the file didn’t.
That changes what the “do I need a data scientist” question is even asking. It’s seldom about whether your method is fancy enough. It’s about how cheaply you can refresh the thing. A spreadsheet built by one person who understands its formulas stays accurate exactly until that person gets busy, and then it ages in place. Hiring a data scientist doesn’t stop the decay either. It just moves the bottleneck to a more expensive calendar. What actually keeps a forecast useful is making it cheap to redo. This guide walks through the common ways teams forecast revenue, shows where each one quietly goes stale, and gets to forecasts that update themselves without adding a single head.
Why this matters more than it used to
Revenue forecasts decide things. Hiring plans, inventory commitments, board reporting, how much runway you tell yourself you have. Get the number wrong and you’ve misallocated across the whole company, not one line item.
None of that is news to you. What’s changed is the speed. Buying behavior moves faster, product lines launch and eat into each other, and a single enterprise deal slipping a quarter can blow up a SaaS projection that looked airtight in the spreadsheet. Picture a DTC brand that built its annual plan on last year’s run rate, then watched a competitor undercut them in Q2. The formula had no way to know. It kept projecting the old curve while real revenue bent underneath it, and the team didn’t notice until the numbers came in soft.
The penalty for a slow forecast has gone up. The penalty for an inaccurate one is the same as it ever was. Teams that treat forecasting as a living signal instead of a quarterly chore tend to see the turn coming while there’s still time to do something about it. For the sales side of this, our piece on predictive sales analytics goes deeper.

The common methods, and what each one is good for
Most revenue forecasting falls into a handful of approaches. They all work in the right context. They all break in a specific way.
- Historical run rate. Take recent revenue, extend the line. Fast, and fine for a stable business with a short planning window. It falls apart the moment the market shifts, because it assumes tomorrow looks like yesterday.
- Bottom-up. Deals times close rate times average deal size. The honest favorite for sales-led teams, and the basis of most good pipeline forecasting. It gets unwieldy at high deal volume, and it’s only as trustworthy as your reps’ stage hygiene.
- Top-down. Start with market size, work down to your share. Great for a fundraising deck. Too coarse to plan operations against, because “1% of a big number” isn’t a number you can staff to.
- Cohort-based. Forecast each customer segment separately, then add them up. More accurate than a single blended line, and worth the effort when segments behave differently. The catch is upkeep. Someone maintains it by hand, every cycle.
- Moving average and time series. Rolling windows smooth the noise so one weird month doesn’t whipsaw your plan. Useful, and backward-looking by design. It tells you the trend, not the turn.
Notice the pattern. The more accurate methods, cohort and time series, cost the most human effort to keep current. That tradeoff is the whole story.
Where these methods quietly fall apart
Spreadsheet forecasting holds up until it doesn’t, and the failure is rarely dramatic. No alarm goes off. The model just drifts from reality while everyone keeps trusting it.
A few predictable failure points. Seasonality the formula never learned. A pricing change, a behavior shift, a new segment that doesn’t fit the historical shape. And the big one: maintenance. In my experience working with finance and RevOps teams, the forecast itself takes an afternoon. The data prep, the joins, the chasing down of why two systems disagree, that eats the week. People end up spending most of their forecasting time wrangling inputs rather than making the judgment call the forecast exists to support. When the model finally is wrong, nobody catches it until the quarter closes and the review meeting gets awkward.
The deeper issue ties back to where we started. Every one of these methods produces a snapshot. Its accuracy starts eroding the day you save the file, and how fast it erodes comes down to how often a human is willing to rebuild it. So this is a refresh problem first, a math problem second. Squeezing out a bit more raw forecasting accuracy matters far less than shrinking the time between refreshes.

Forecasting that updates itself, no data scientist required
A staleness problem gets solved by automation. Sophistication barely touches it. If a model can rebuild itself on new data, accuracy on paper and accuracy in practice finally become the same thing.
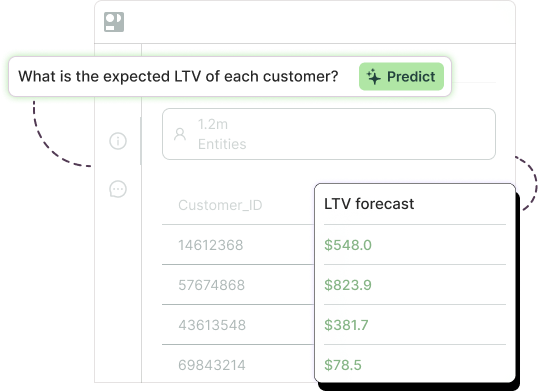
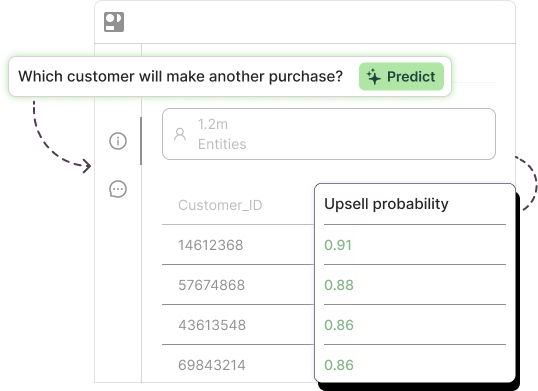
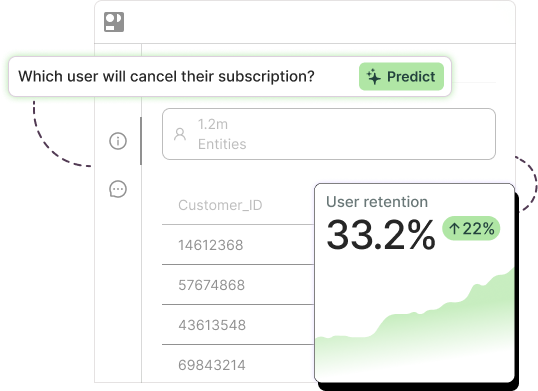
That’s the idea behind AI forecasting. Rather than hand-building formulas, you connect your historical revenue data and let a machine learning model find the patterns across far more signals than a spreadsheet could ever hold. With Pecan’s Predictive AI Agent, the flow is built for business teams, not data scientists:
- Ask. You start with a plain business question. “What will revenue look like by segment next quarter?”
- Automate. Pecan connects to your data with SQL where it already lives, your warehouse, and handles the data preparation itself.
- Train and validate. Model selection, training, and statistical validation run automatically. No code, no tuning, no notebook open at midnight.
- Deploy. Forecasts land where you work, in Salesforce, HubSpot, or your warehouse, and they come with confidence intervals rather than a single brittle number. As new data flows in, the model updates, so the version in front of you stays current on its own.
That last point is the one that carries everything above. A forecast with a confidence range tells you not just the expected number but how much to trust it, which is exactly what you want before you commit a hiring budget to it. And because the model refreshes itself, it doesn’t age the way a spreadsheet ages. Nobody has to remember to rebuild it. The same approach reaches past revenue into production forecasting and broader demand forecasting tools, wherever a stale number quietly costs you money.
One honest caveat. You still need enough history to learn from, roughly a year or more of revenue data you can pull from your CRM, billing system, or warehouse. The agent handles the prep and the modeling for you. It can’t conjure a pattern out of three months of data. Nothing can.
How to actually get started
You don’t have to throw out your spreadsheets this afternoon. Start here.
- Check your history. Do you have a year or more of revenue data sitting somewhere you can pull it, CRM, billing, or warehouse? That’s the real prerequisite, more than any tool decision.
- Define the forecast. Total revenue is the easy answer and rarely the useful one. By segment, by product, by region tends to drive sharper decisions, and it’s where backward-looking methods struggle most.
- Match the approach to your stage. Early and stable? A spreadsheet model is genuinely fine, and anyone telling you otherwise is selling something. Hitting the point where manual upkeep eats your week and the numbers still slip? That’s your signal to automate.
- Validate before you trust it. Hold out a recent period, forecast it, then compare against what really happened. Do this with any method, spreadsheet or AI. A forecast you haven’t back-tested is a hope with a chart attached.
The number worth watching
Most teams will keep grading their forecasts on accuracy after the fact, which mostly tells you how good you used to be at predicting a quarter that’s already over. The more useful habit is watching how current your forecast is right now. A rough projection refreshed every week will beat a beautiful one refreshed twice a year, every single time. Build for the refresh, and accuracy mostly takes care of itself.

Tammy is a Data Engineer at Pecan AI with over a decade of experience across B2C subscriptions, B2B SaaS, and freemium digital revenue models. At Pecan, she works at the intersection of scalable data infrastructure and predictive analytics, helping organizations turn raw data into actionable forecasts into actionable forecasts.