Most articles like this one hand you a checklist of unrelated headaches. Dirty data over here. A skills gap over there. A dashboard nobody opens. Fix each one, the logic goes, and your analytics function gets healthier.
We look at it differently. After years of sitting next to analytics teams while they work, we keep hearing the same seven complaints, and the same root sits underneath all of them. Analytics has spent decades getting very good at one thing: explaining what already happened. The part that actually changes a decision, knowing what happens next, stayed locked away with a small group of specialists. That single split is responsible for most of the seven problems below. The data goes unused because someone has to decide what’s worth modeling. The insights gather dust because they describe yesterday. Time-to-value drags because every new question restarts the whole pipeline.
The thing reshaping analytics right now is agentic AI: tools that move from surfacing an insight to acting on it. Pecan’s Predictive AI Agent runs the full predictive workflow from a plain business question, so the people who own the decision get a validated forecast without waiting in a data science queue. If you want the deeper version of how that fits with the language models everyone’s already using, we wrote about how LLMs and data analytics work together.
So as you read the seven problems, keep one idea in mind. Some of these are real technical hurdles worth solving head-on. Others mostly disappear the moment your team stops organizing its work around hindsight. We’ll point out which is which.
The quick version:
- Historical reporting answers questions that already expired. Predictive analytics answers the ones still open.
- Insights get ignored when nobody can act on them inside the tools they already use.
- Most company data never gets touched, not for lack of value, but for lack of hands.
- Hand-built models carry human bias by design.
- Long time-to-value comes from rebuilding everything for every new question.
- Security worries scale with every new tool you bolt on.
- The day-to-day grind of prep, cleaning, and tuning eats the analyst alive.

Problem 1: Historical insights have a short shelf life
The most common use of data analysis is descriptive analytics. You take historical data, study it, and explain past trends and events. Useful work. It tells you what your customers did and where the business has been.
The trouble is what that work can’t do. Past trends describe a world that may no longer exist, and in a fast-moving market, “no longer exists” can mean last quarter. Lean only on history and you start steering by the rearview mirror. A retailer that stocks shelves purely on last year’s sales will keep missing the shift in what people want this year. The numbers were accurate. They were also late.
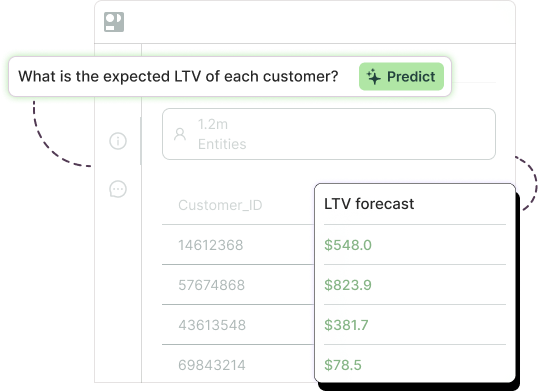
Predictive analytics changes the question from “what happened” to “what’s about to.” Feed a model the right signals and it surfaces patterns a person scanning a report would never catch, then turns them into forecasts your team can act on before the window closes. You complement the history you already trust with a forward view you can plan around. That’s the difference between reacting to a trend and getting in front of one.
Problem 2: Insights never get used
Nobody enjoys pouring weeks into work that ends up ignored. Yet that’s the quiet fate of a lot of analytics.
Statistical findings get treated as background noise when stakeholders can’t see a clear next move in them. This happens most with descriptive analytics, where the focus stays on the past. So analysts build careful dashboards and reports, and those reports sit untouched while the business runs on gut feel anyway. The insight existed. The path from insight to action did not.
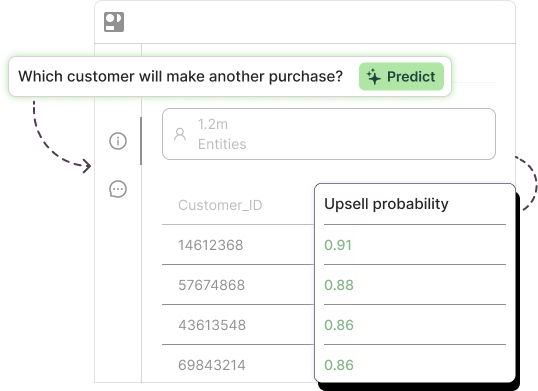
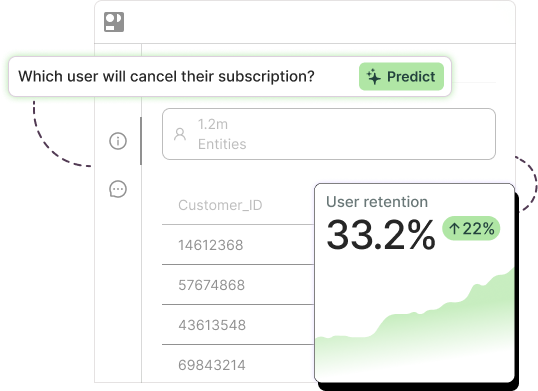
The fix is to generate predictions that point at a specific decision, then drop them where the decision actually gets made. Say your goal is reducing customer churn. Instead of a churn report, you push churn predictions straight into your CRM, scored customer by customer. Now a colleague in marketing can build a retention campaign around the segment most likely to leave, without ever opening an analytics tool. The work gets used because it arrives already pointed at something.
Problem 3: Most of your data goes unused
Companies collect staggering amounts of data. Then they use almost none of it. Forrester has long estimated that between 60% and 73% of enterprise data is never used for analytics, and that figure still gets cited in 2026 because the underlying problem hasn’t gone away. The data is there. The human capacity to think through all of it is not.

Part of the reason is that an analyst can only hold so many variables in their head at once. So teams fall back on a handful of rule-based models that juggle two or three variables at a time. Everything else, the messier signals, the fields nobody’s sure about, the sources that don’t fit neatly, gets left on the floor. Not because it’s worthless. Because there aren’t enough hours to vet it.
This is where the agentic shift earns its keep. Rather than asking an analyst to decide upfront which data deserves attention, the agent handles that step itself. You point raw data at it, from sales records to user engagement data to demographics, and it works out which signals matter through data prep and feature selection, then builds the best model that data supports. We go deeper on that in our piece on automating data analysis with AI. The practical result: the 60% you were ignoring gets a vote, and you refresh predictions on new data as often as you like.
Problem 4: Bias is baked into hand-built models
Traditional predictive modeling is rigorous. It’s also human. And humans choose the variables.
That choice is where bias creeps in. A hand-built model will, sooner or later:
- Include variables that look related to the outcome but aren’t actually driving it.
- Skip variables that matter because they clashed with the builder’s assumptions.
- Carry forward, or even amplify, existing bias when the inputs are skewed.
- Fail to hold up outside the narrow slice of data it was trained on.

Automated feature engineering takes a different path. It generates and tests thousands of candidate variables, then keeps the ones that genuinely predict the outcome, rather than the ones a person happened to think of. More variables, evaluated on merit, also means more accurate forecasts. And because a clear dashboard shows how much each feature shaped a given prediction, you can spot a bias hiding in your raw data and deal with it, instead of shipping it into production. This is one of the practical wins of machine learning in predictive analytics: the model isn’t guarding anyone’s preconceptions.
Problem 5: Time-to-value drags on
Plenty of analytics tools demand heavy change management and engineering help before they deliver a thing. The projects themselves swallow time and budget, and some of them never pay off.
The wider industry feels this acutely. Anaconda’s 2025 State of Data Science and AI report found that only 22% of organizations describe their AI deployment as strategic, with most still stuck in what the report calls pilot purgatory. Anaconda’s own deployment guidance puts it bluntly: timelines that teams plan in days or weeks routinely stretch into months once production infrastructure enters the picture.
An agentic approach compresses that timeline hard. You ask a business question, the agent sets up the workflow, builds and validates the model, and returns a forecast you can act on, with the heavy lifting handled behind the scenes. Across our own deployments, predictive models reach production in roughly a week, up to 32 times faster than traditional data science work. There’s a maintenance payoff too. A rule-based model often needs rebuilding from scratch as data shifts, while an automated model is built once and kept current with retraining and monitoring. You feed it fresh data; it keeps up.

Problem 6: Data-security concerns slow everything down
Set the technical hurdles aside for a moment. Security rules and regulations alone can make stitching data tools together feel risky, and risk tends to stall adoption.
The stakes are easy to underrate. According to IBM’s 2025 Cost of a Data Breach Report, the global average cost of a breach is $4.44 million. That’s up from the $3.86 million figure we cited when this post first ran, and notably, it’s the first year-over-year decline IBM has recorded in five years, which they credit to faster AI-assisted detection. So the trend is encouraging and the number is still enormous. Asking an analyst, who is not a security specialist, to manage and connect sensitive data across a dozen tools is asking a lot.
A single platform that takes security seriously removes much of that weight. Pecan protects sensitive information throughout the predictive workflow with enterprise-grade controls, so the analyst can focus on the analysis instead of moonlighting as a security officer.
Problem 7: The day-to-day grind wears analysts down
If the rest of this post hasn’t made it obvious: turning raw data into something useful is genuinely hard work. And the person carrying that load deserves a mention.
Manual analytics is a stack of tedious steps. Collection. Data preparation. Transformation. Visualization. The statistical analysis itself. Then layer on the tool sprawl, Python or R, Tableau or Power BI, SPSS or SAS, each with its own quirks. And when the incoming data is incomplete or inconsistent, which it usually is, the whole thing gets shakier and slower.
Automation lifts most of that off the analyst’s plate. Pecan handles prep, feature engineering, machine learning model building, tuning, deployment, and monitoring, and it cleans and reshapes messy data into training-ready form along the way. Freed from the grind, analysts get to do the part that actually needs a human: figuring out which business problems are worth predicting, and what to do once the prediction lands.
Where this leaves you
Look back at the seven problems and the pattern from the opening holds up. A couple of them, security especially, are real and worth tackling directly. The rest are mostly symptoms of analytics built to explain the past. Reorient around prediction, and hand the mechanical work to an agent, and they shrink on their own.
That’s the shift worth making in 2026. Not a faster version of the old reporting treadmill, but a different question entirely: what’s about to happen, and what should we do about it while there’s still time to act? The teams asking that question are the ones pulling ahead.
Curious what this looks like on your own data? Book a 30-minute demo and we’ll build a tailored model with you.

Tammy is a Data Engineer at Pecan AI with over a decade of experience across B2C subscriptions, B2B SaaS, and freemium digital revenue models. At Pecan, she works at the intersection of scalable data infrastructure and predictive analytics, helping organizations turn raw data into actionable forecasts into actionable forecasts.