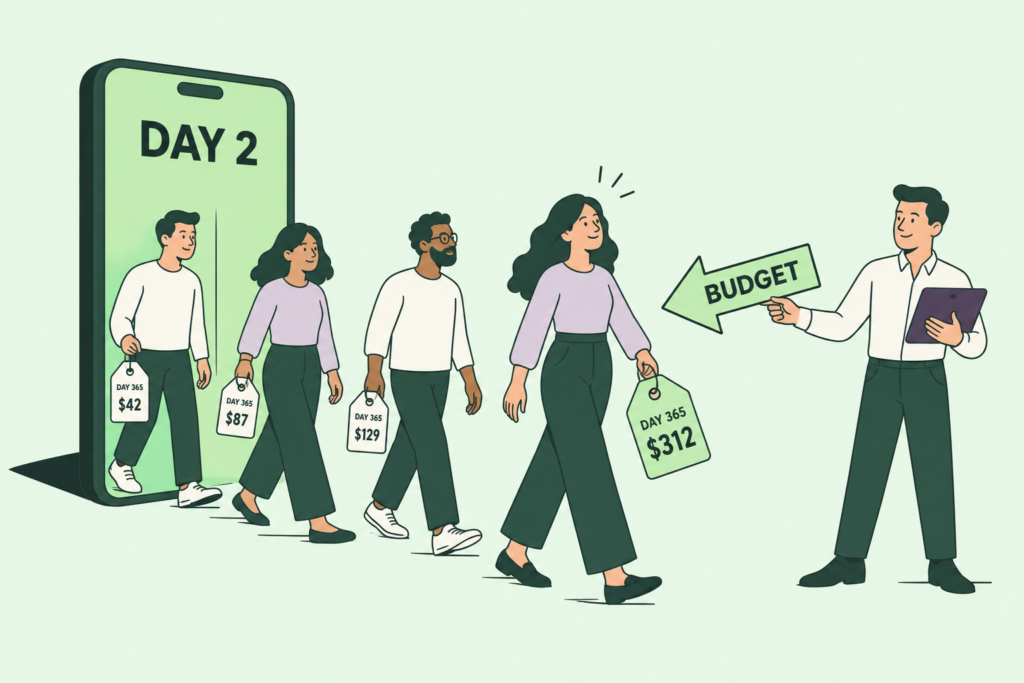
Predictive analytics uses historical data, statistical modeling, and machine learning to estimate the likelihood of future outcomes, such as which customers will churn, how much demand a product will see next month, or which leads will convert. The output is a score or forecast for a specific entity over a specific time window, not a summary of what already happened.
That last part is the whole difference between prediction and reporting. A report tells you 6% of subscribers cancelled last quarter. A prediction tells you which 400 subscribers are most likely to cancel in the next 30 days, while there’s still time to call them.
We’ve written this guide from operating experience rather than theory. Thousands of predictive models have been built on the Pecan platform across retail, fintech, subscription, gaming, and manufacturing, and the most common first question a new customer brings us is some version of “who is about to leave.” That vantage point shapes what follows: we’ll spend more time on the parts that decide whether a model gets used (the question, the validation, the deployment) and less on the parts that get all the attention (the algorithm).
What is predictive analytics? (definition)
The definition we use internally, because it forces the right conversation: predictive analytics is the practice of assigning a probability or a numeric forecast to a future event for each entity you care about, using patterns learned from that entity’s history and the history of entities like it.
Three words in that sentence do most of the work.
Entity. A customer, an account, a SKU, a store, a lead, a shipment. Predictions attach to something you can act on.
Future event. Churn, purchase, conversion, stockout, default, return. It has to be an outcome you can observe later, so the model can be checked against reality.
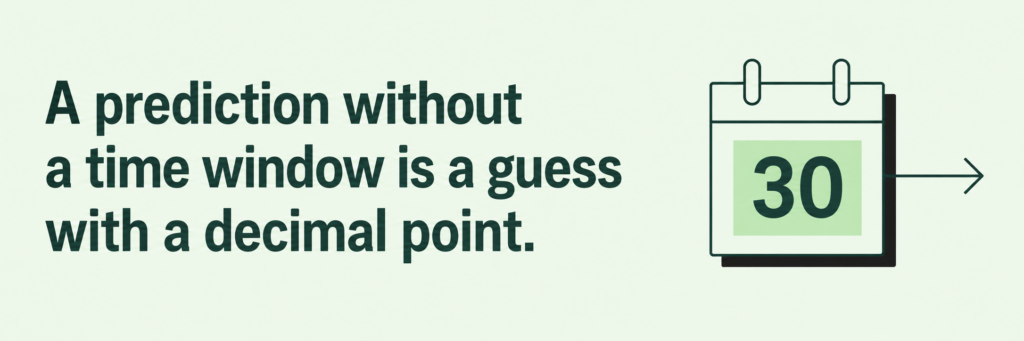
Window. Next 30 days, next quarter, next 6 months. A prediction without a time frame is a guess with a decimal point.
By that standard, “predict churn” is not a predictive question yet. “For every active subscriber, what’s the probability they fail to renew in the next 30 days?” is one. Getting that sentence right is, in our experience, harder than any modeling step, and it’s where most first projects go sideways.
If you’re mapping the wider vocabulary, predictive modeling is the technical act of building the model; predictive analytics is the business practice that includes asking the question, validating the answer, and acting on it.
How predictive analytics works, in 5 steps
Every predictive project, whether it’s built by a data science team over six months or by an analyst in an afternoon, passes through the same five gates. The tooling changes. The gates don’t.
1. Data: collect the history
The model learns from what already happened, so the raw material is historical, event-level data: transactions, logins, orders, tickets, campaign touches, shipments. It lives in your warehouse, your CRM, your billing system, and usually a few spreadsheets nobody admits to.
A note we repeat a lot: this data does not need to be clean. Real business data is messy, duplicated, inconsistently timestamped, and full of gaps. A good predictive process handles that as part of preparation. Waiting for perfect data is the most common reason companies never build a first model.
2. Target definition: decide exactly what you’re predicting
This is where the entity, event, and window from the definition above get pinned down. You also decide the “marker”: the moment in time at which the prediction is made. If you want to predict churn 30 days out, the model can only use information that existed on the marker date. Anything after it is cheating (more on that in the accuracy section).
3. Model training: find the patterns
The data gets reshaped into a training set: one row per entity, hundreds of columns describing its history up to the marker, and one label saying what happened next. An algorithm then learns which combinations of history predict the label. Feature engineering, the work of turning raw events into those descriptive columns, is where most of the human hours traditionally go. Automated platforms now do the bulk of it.
4. Validation: check it against reality
Before anything goes live, the model is tested on entities it has never seen, ideally from a later time period than the training data. This is where you learn the honest accuracy number, catch data leakage, and decide whether the model is good enough to act on. Skipping or rushing validation is how teams end up with a “94% accurate” model that falls apart in production.
5. Deployment: put the scores where decisions get made
A prediction sitting in a notebook changes nothing. The scores need to land in Salesforce, HubSpot, the warehouse, the marketing automation tool, or wherever the team that acts on them already works, and they need to refresh on a schedule. Then someone has to monitor the model over time, because customer behavior drifts and last year’s patterns stop holding.
If you want the agentic version of this pipeline explained end to end, our guide to predictive AI agents walks through how each step gets automated.

Predictive analytics techniques and models
People ask “which algorithm should I use” far more often than the question deserves. The technique follows from the shape of the question. Four families cover almost everything a business team will ask.
Regression answers “how much.” The model outputs a number. Predicted lifetime value for a new customer, expected order value next month, likely days until a lead closes. Linear regression is the textbook version; in practice, tree-based methods like gradient boosting usually win on messy business data.
Classification answers “will this happen, yes or no” and returns a probability. Churn, conversion, fraud, return likelihood. Most first predictive projects are classification problems. Logistic regression, random forests, and gradient-boosted trees (XGBoost, LightGBM) are the workhorses.
Time series forecasting answers “what will this metric be over time.” Units sold per SKU per week, call center volume by hour, revenue by region by month. It’s a different beast because the sequence matters: last week’s value influences this week’s. Exponential smoothing and ARIMA are the classical tools; modern approaches fold in external drivers like promotions, weather, and holidays.
Ensemble methods combine several models and let them vote or average. They’re less a separate technique than a way of squeezing extra accuracy out of the other three, and they’re the default in most automated platforms because they’re hard to beat on tabular data.
There are also unsupervised techniques (clustering, anomaly detection) that find structure without a label to predict. They’re useful for segmentation and fraud, but they don’t produce a forecast in the strict sense.
For a deeper walk through each algorithm and when to reach for it, see our guide to predictive analytics techniques, and for the modeling side specifically, the predictive modeling guide.
Predictive analytics examples with real outcomes
Yes, Amazon uses predictive analytics for demand and Netflix uses it for recommendations and retention. Those are the examples every article cites, and they’re true. They’re also built by some of the largest machine learning organizations on earth, which makes them a poor benchmark for a mid-market team with three analysts and a Snowflake instance.
What that team actually does with prediction, using figures published on our customer pages:
Churn: The Credit Pros
The Credit Pros, a credit repair fintech, wanted to catch client churn before it happened. Previously, building a churn model took about three months. With Pecan, their data analyst, Michael Mgbame, had a production model in two to three weeks. The model predicts the probability each client churns 30 days after a given date, and those probabilities are written into Salesforce so the business team can design retention treatments. The result was longer client retention and increased revenue. Read the full Credit Pros story.
Lifetime value: PlaySimple
PlaySimple, a mobile game maker whose titles run on in-app advertising, needed to know a player’s value early enough to steer ad spend. Their pLTV models predict Day 30 lifetime value using only Day 2 data and achieved 95% accuracy. Those predictions now guide campaign management across Meta and Google. Read the PlaySimple story.
Demand: a high-tech manufacturer
A Tier II supplier to some of the world’s largest manufacturers was forecasting subcomponent demand with non-scientific methods, which meant simultaneous understock and overstock. They connected CRM, marketing, ERP, and external data, and had a fully trained demand forecast model in under 14 days. Forecasts at 3- and 6-month intervals reached 75 to 85% accuracy (higher on top-selling products), and the outcome was 15% labor cost savings, over 25% inventory cost savings, and a 20% reduction in machine changeover time. Read the manufacturer story.
Three different questions, three different techniques (classification, regression, time series), and one shared pattern: each team defined a precise question, got a validated model in days or weeks rather than quarters, and pushed the output into a system where someone could act on it.

The benefits (and what they actually depend on)
The benefits of predictive analytics get listed the same way in every vendor deck: better decisions, lower costs, higher revenue, less risk. All true. All useless without the conditions attached, so here are the conditions.
Lead time is the real product. The value of knowing a customer will churn depends entirely on how early you know it and whether a retention offer can change the outcome. A model that flags churn the day before renewal gives you nothing to do. The 30-day window The Credit Pros chose, or the “two weeks after recharge, will they fail to renew next month” window Whistle Express used, were picked so that marketing had time to act. The benefit lives in the window, not the model.
Precision beats accuracy for targeting. If you can only afford to call 500 at-risk customers, what matters is how many of your top 500 scores are real churners, not the overall accuracy number. Across Pecan deployments, retention teams have averaged roughly 12% churn reduction, and that’s achieved by concentrating spend on the top of the ranked list, not by treating everyone.
Deployment decides adoption. A churn score that lives in a dashboard nobody opens will not reduce churn. A churn score in the CRM record, refreshed daily, that triggers a task, will. This sounds obvious. It’s the step that gets skipped most.
Speed compounds. When a model takes six months to build, you build one. When it takes a week, you build the churn model, then the upsell model, then the demand model, and each one teaches you something about your data that improves the next. Across our customer base, models reach production in about a week, up to 32x faster than traditional data science approaches, and the second and third models are always easier than the first.
The honest summary: predictive analytics pays off when the question has a window, the output has a home, and someone owns the follow-through.
How accurate is predictive analytics?
Accuracy depends on the data, the question, and the horizon. Anyone who quotes a single number for “how accurate predictive analytics is” is selling something.
Still, realistic ranges exist, and these are the ones we see in practice. Churn and conversion models on decent behavioral data typically land in the 0.75 to 0.90 range on AUC, which translates loosely to “the model ranks a real churner above a non-churner three to nine times out of ten.” Lifetime value models vary widely with how early you predict; PlaySimple’s 95% at Day 2 is at the strong end. Demand forecasts on stable products usually land between 75 and 90% accuracy; on new products with little history, expect worse and plan for it. A model that’s 70% accurate on a problem where you were previously guessing can still be enormously profitable, because the alternative was a coin flip.
The more useful question is not “how accurate is it” but “how do I know whether to trust this particular model.” We publish our approach to that as model health checks, and it’s worth understanding even if you never touch our platform, because these are the failure modes that quietly wreck predictive projects.
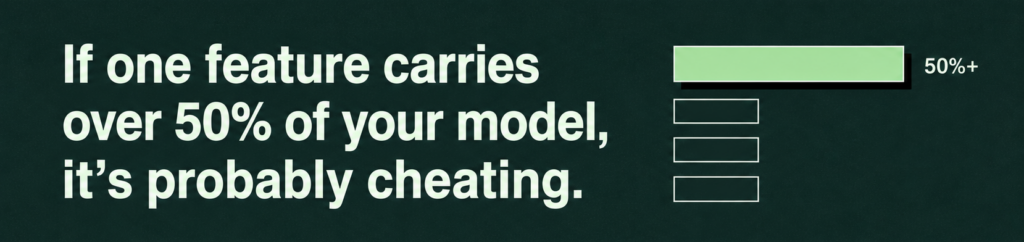
Leakage. The model was trained on information that wouldn’t exist at prediction time. The classic example is a “cancellation_date” column in a churn model. Symptoms: accuracy that looks too good, and one feature carrying more than half the model’s importance. Our help center guide on how to determine if your model is healthy treats a single feature above 50% importance as a red flag for exactly this reason, and we’ve written separately about data leakage in predictive models because it’s the single most common way a first model lies to you.
Overfitting. The model memorized the training data instead of learning general patterns. Symptom: a large gap between performance on training data and performance on held-out data. A gap of more than 20 points on the main metric is a warning sign.
Label drift. The thing you’re predicting changed. Churn during a price increase looks different from churn in a normal quarter. If the base rate in your training window doesn’t match today’s, the scores will be miscalibrated.
Too little data. Some questions simply don’t have enough history to answer yet. A model trained on 40 positive examples is a story, not a model.
Benchmark comparison. Any model should beat a naive baseline (predict the average, or predict last period’s value). If it doesn’t, the features aren’t carrying signal.
If a platform or a consultant hands you a model without answering those five questions, ask them. Accuracy that can’t be explained isn’t accuracy you can budget against.
Is predictive analytics AI?
Partly, and the overlap is where the confusion comes from. Predictive analytics is the business practice: define a future question, model it from historical data, act on the answer. Machine learning is the set of algorithms most often used to build those models, and machine learning is a branch of AI. So predictive analytics uses AI, but it’s older than the current wave (insurers and credit bureaus were doing it with regression decades ago) and it doesn’t require deep learning or large language models. In fact, for tabular business data, classical machine learning usually beats LLMs on prediction tasks; language models are better used to guide the workflow than to score the customers. We unpack the distinctions in predictive analytics vs machine learning.
Predictive vs. descriptive vs. prescriptive analytics
Think of these as three tenses.
Descriptive analytics is past tense: what happened. Revenue by region, churn rate by cohort, conversion by channel. This is the territory of dashboards and business intelligence. Diagnostic analytics (why it happened) usually gets folded in here.
Predictive analytics is future tense: what is likely to happen, per entity, in a window. Scores and forecasts.
Prescriptive analytics is imperative: what should we do about it. Given these churn scores and this retention budget, which customers get which offer. In practice, prescriptive is often a set of business rules or an optimization layered on top of predictions rather than a separate technology.
The mistake we see most often is treating these as a ladder where you must perfect one rung before climbing to the next. You don’t. A BI team with clean KPIs and a warehouse is already most of the way to a first predictive model. The tables are the same; what changes is the direction of the timestamp. We go deep on that in BI vs predictive analytics.
Common myths, briefly
“You need a data science team.” You need someone who understands the business question and the data. The heavy lifting (feature engineering, algorithm selection, validation, deployment) has been automated to the point where analysts run predictive programs at companies like Whistle Express, whose data team was three people. Data scientists are wonderful. They’re no longer a prerequisite.
“Our data isn’t clean enough.” It never will be, and it doesn’t have to be. Predictive models are trained on the messy transactional history you already have. Cleanliness is a preparation step, not an entry ticket. The signal is usually in the mess.
“Predictions are a black box.” Bad ones are. Good ones come with feature importance (which factors drove the score), confidence levels, and validation metrics you can read. If you can’t see why a customer scored 0.82, that’s a tooling problem, not a property of prediction.
How to get started without a data science team
The sequence we’d recommend to any team starting from dashboards:
Start with one question that has a deadline, something like “which of our subscribers will fail to renew in the next 30 days” or “which open leads will reach a second call this quarter.” The window should give the acting team time to do something.
Check your history. You need a reasonable number of past examples of the outcome. A couple of years of leads with a conversion flag, or a year of subscription records with cancellation dates, is usually plenty. You do not need PII, and you do not need the data to be tidy.
Pick the tool by the skills you have, not the skills you wish you had. If you have data scientists with time, an ML platform or open-source stack gives them full control. If you have analysts and business owners, look for a platform that takes a plain-English question and handles preparation, training, validation, and deployment itself, and that shows its validation work so you can trust the output. Our roundup of predictive analytics tools compares the main categories honestly.
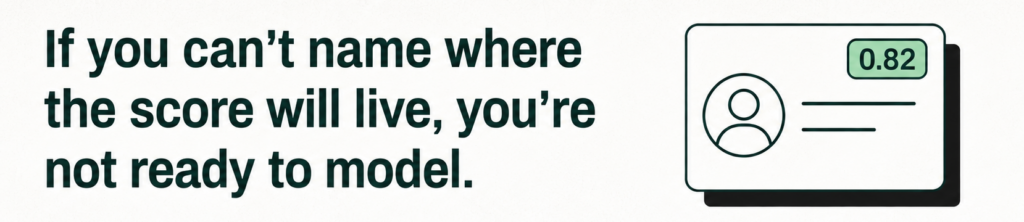
Decide where the prediction will live before you build it. CRM field? Warehouse table? Weekly ranked list emailed to the retention team? If you can’t name the destination, you’re not ready to model.
Validate, deploy, measure. Run the first model, check the health checks, push the scores, then hold out a control group so you can prove the lift. The first model is rarely the best model. Its job is to prove the loop works.
On cost: the comparison that matters is platform price versus a data science hire, six months of build time, and the revenue lost while you wait. Even the shortcut isn’t always short: according to G2’s State of Low-Code Machine Learning in 2026, low-code ML platforms take an average of 4.5 months to deploy.
If you’d rather see the loop run on your own data than read about it, book a demo and we’ll build a first model on a real question during the call.
What are examples of predictive analytics?
What skills are needed for predictive analytics?
Which tool is best for predictive analytics?
Do Amazon and Netflix use predictive analytics?
What is the difference between predictive analytics and machine learning?

Asaf is the Head of Customer Success at Pecan AI, where he helps enterprise customers turn predictive analytics into real, measurable business outcomes. He’s grown through Pecan from AI Success Manager to Team Lead to Director, bringing a strategic consulting background and an Economics degree from the Hebrew University of Jerusalem (plus a serious scuba diving habit).