The world produced 149 zettabytes of data in 2024 (a zettabyte is 1 billion terabytes). By the end of 2025 that figure hit 181 ZB, and IDC projects we’ll cross 394 ZB by 2028. Numbers that big stop meaning anything fast. Here’s a more useful frame: roughly 90% of all data ever created has come into existence in the last two years, and most of it sits in formats that traditional analytics tools can’t actually read.
That gap between what we collect and what we can use comes down to one thing. The structure (or lack of it) baked into the data itself.
Most data falls into three buckets: structured, unstructured, and semi-structured. The differences sound academic until you try to build something on top of them. Then they decide what’s possible and what isn’t.
Below, we’ll walk through each type, where it lives, what it looks like in real systems, and how it fits into machine learning and actionable predictive analytics. By the end you’ll have a clean mental model of what your data actually is, and what you can do with it.

What is structured data?
Structured data is information organized into a fixed, predefined schema. Rows and columns. Field types decided in advance. A row in your customer database has the same shape as every other row, and you know what each cell contains before you look.
Business teams work with this kind of data every day. It lives in relational databases queried with SQL, in spreadsheets, in CRMs like Salesforce or HubSpot, in ERP systems, and in modern data warehouses such as Snowflake, BigQuery, and Redshift. If you’ve ever filtered a column or pivoted a table, you’ve worked with structured data.
Here are some concrete examples of structured data in a business context:
- Transaction records with fields like date, customer ID, product SKU, quantity, and amount.
- CRM contact data including name, email, company, lifecycle stage, and last activity date.
- Financial records like revenue figures, expense categories, and account balances.
- IoT sensor readings capturing temperature, pressure, location, and timestamps.
- Inventory data tracking SKU, warehouse location, quantity on hand, and reorder thresholds.
- Web analytics metrics such as session counts, page views, bounce rate, and conversion rate.
- Support ticket metadata like priority, status, assigned agent, and response time.
What makes structured data powerful is also what limits it: every record has to fit the schema you defined. Add a new field and you’re updating tables, possibly migrating millions of rows. Within those constraints, the data is fast to query, easy to aggregate, and ready to feed straight into predictive models with minimal preprocessing.
By most industry estimates, structured data accounts for 10% to 20% of all enterprise data. Small slice. Outsized value.
You’ll sometimes see structured data split into types: numeric, categorical, datetime, boolean, and identifier fields. Numeric and datetime fields tend to do the heaviest lifting in predictive models because they capture patterns over time. Categorical fields (region, product type, customer segment) add context. Identifiers tie records together across systems so a transaction can be linked to a customer, a campaign, or a support case. The shape of these fields, more than their volume, decides what kinds of predictions you can build.
What is unstructured data?
Unstructured data is everything else. No schema, no rows, no predefined fields. Just content in whatever format it was created.
It’s the email thread your support team had with a frustrated customer last week. The 30-minute sales call recording sitting in Gong. The PDF contract you signed last month. The product photos on your e-commerce site. The free-text “Other (please specify)” responses on your last NPS survey.
According to research cited from Gartner, 80% to 90% of enterprise data is unstructured, and it’s growing roughly three times faster than structured data. IDC research suggests IoT devices alone will generate over 73 zettabytes of data per year by 2025.
Some common categories:
- Customer conversations: support emails, chat transcripts, call recordings, and social DMs.
- Social and review content: posts, threads, Google reviews, and product comments.
- Visual media: product images, marketing video, user-generated content, and screenshots.
- Audio: call center recordings, meeting transcripts, podcast episodes.
- Documents: PDF reports, scanned contracts, internal memos, and pitch decks.
- Open-ended survey responses and other free-text inputs.
- Web content: news articles, blog posts, forum threads.
Why does unstructured data matter so much if it’s hard to work with? Because it carries the why behind the what. Structured data tells you a customer canceled their subscription. The exit survey response, written in their own words, tells you it was because your onboarding email never arrived. One of those facts is more useful than the other if you actually want to fix the problem.
You can’t point a SQL query at a folder of MP3 files. Pulling value out of unstructured data takes natural language processing for text, computer vision for images, speech-to-text for audio, and a lot of patience. Tools are improving fast. The work is still real.

What is semi-structured data?
Semi-structured data sits in the middle. It has organizational properties (tags, hierarchies, metadata) but doesn’t fit cleanly into a relational table. There’s structure in there if you know where to look. The structure just isn’t enforced the way it is in a database.
Modern data pipelines actually live here in many cases. APIs return JSON. Application logs follow loose conventions. Email headers are structured even though email bodies aren’t. The web runs on semi-structured formats whether anyone admits it or not.
Frequent formats include:
- JSON is the lingua franca of web APIs and modern applications. Hierarchical, flexible, easy to extend without breaking existing consumers.
- XML is older and more verbose but still widely used in financial services, healthcare, and legacy enterprise integrations.
- CSV is technically tabular, but the schema is implied rather than enforced. The column you assumed was always an integer can suddenly contain a string and nothing will stop it.
- Email has structured headers (sender, recipient, timestamp, subject) wrapped around an unstructured body.
- Log files are timestamped and roughly formatted, but each line’s content varies depending on what the system decided to record.
- Markdown and HTML carry structure in their tags, while the content between tags is freeform.
These formats have been quietly winning for years. Document databases like MongoDB, search engines like Elasticsearch, and cloud object stores all favor flexible schemas over rigid ones. About 60% of corporate data is now stored in the cloud, and a meaningful chunk of that lives in semi-structured form.
Out of the three types, this one tends to get the least attention in data conversations, which is funny because it’s probably what your data engineers wrestle with most days. JSON parse errors don’t make the keynote slides.
Structured vs. unstructured data: key differences
Here’s the side-by-side comparison that matters when you’re deciding what to do with your data:
| Factor | Structured data | Unstructured data |
| Format | Rows and columns, predefined schema | No fixed format |
| Storage | Relational databases, data warehouses | Data lakes, NoSQL stores, object storage |
| Examples | CRM records, transactions, sensor data | Emails, images, video, chat logs |
| Ease of analysis | Standard SQL queries work directly | Requires AI/ML, NLP, or computer vision |
| Search | Simple keyword and field queries | Needs indexing, embeddings, or NLP |
| Scalability | Scales vertically (more rows) | Scales horizontally (distributed storage) |
| Volume share | ~10–20% of enterprise data | ~80–90% of enterprise data |
| Use in ML | Direct input to most models | Needs preprocessing or feature extraction |

A handful of these differences carry more weight than the rest.
Volume is the gap that surprises people. If 80% of your data is unstructured, but 80% of your analytics work happens on structured data, you’re making decisions based on a sliver of what you actually know about your business. That mismatch is where most “we should be more data-driven” conversations end up stalling out.
Ease of analysis comes a close second. Structured data is queryable on day one. Unstructured data needs a whole pipeline (extraction, embedding, classification, indexing) before it can answer a question. Either that pipeline gets built or it doesn’t, and most organizations don’t have the headcount to build it from scratch.
Storage shapes the rest of the picture. Structured records live in databases optimized for fast reads against known schemas. Unstructured content sits in object storage (S3, Azure Blob, Google Cloud Storage) where it’s cheap to keep but slow to actually use. Economics push you to keep everything; analysis cost pushes you to ignore most of it.
Pros and cons of each data type
Structured data
Pros are easy to count. SQL has been around since the 70s and isn’t going anywhere. Business intelligence tools like Tableau, Looker, and Power BI all assume structured input. Predictive models for customer churn, customer lifetime value, and demand forecasting all run directly on structured records. Governance is straightforward because you know what every field contains.
Cons come from the same source. The schema is rigid. Adding a new field is a project. You can’t capture the messy reality of customer behavior (frustration, hesitation, intent) inside fixed columns. By definition, this kind of data only contains what someone thought to capture in advance.
Unstructured data
Upside is depth. Unstructured content captures real human behavior in its native form. A 10-minute call recording carries more signal than a six-field call summary. Sentiment, tone, and context all live there. The volume is enormous, which means more raw material for any analysis that can read it.
Downsides are real. Processing costs money and engineering time. Models that read unstructured input (LLMs, vision models, speech-to-text systems) have their own failure modes and biases. Governance is harder because you can’t just inspect a column for sensitive data; you have to scan documents, transcripts, and images. Compliance teams tend to break out in hives at the thought.
How structured and unstructured data power predictive analytics and ML
Almost every predictive model running revenue forecasting, churn prediction, or lead scoring at companies you’ve heard of gets built on structured data. There’s a reason for that. Structured input is already in the shape models expect: rows of features, one per observation, with consistent types. The math works out.
Predictive models for churn, LTV, demand forecasting, and lead scoring all run on the same kinds of inputs your team already has in the warehouse. Transactions, events, profile fields, engagement records. Feed that into the right modeling pipeline and you get useful predictions.
Raw, unstructured input plays a different role. It can’t go straight into a tabular model, but it can be transformed into structured features that do. Sentiment scores extracted from support tickets become a column. Topic labels from sales call transcripts become flags. Image embeddings reduce a product photo to 512 numbers a model can actually use. The unstructured source becomes structured signal, and that signal joins your existing features.
Best predictive setups combine both. A retailer building a churn model might start with structured purchase history, recency, frequency, and average order value. Then layer in sentiment scores from product reviews, support ticket urgency from text classification, and email engagement patterns from clickstream data. Suddenly the model has a richer picture of who’s actually at risk than either source could provide alone. The structured backbone does the predicting; the unstructured signal sharpens it.

Plenty of teams hit a wall right here. Building AI predictive modeling pipelines from scratch takes data engineers, ML engineers, and weeks (or months) of validation work to make sure the model doesn’t quietly fall apart in production. For most business teams, that’s not a realistic ask.
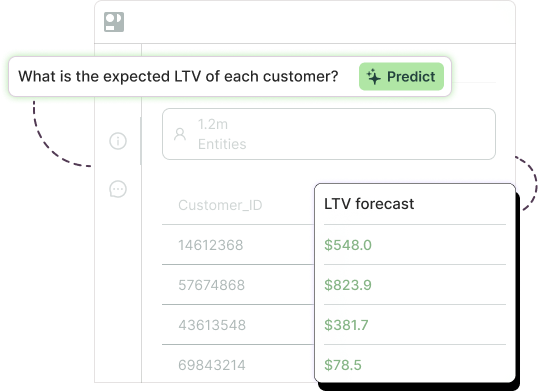
Closing that gap is exactly what Pecan was built for. Pecan’s Predictive AI Agent connects to the structured data you already have (your warehouse, CRM, marketing platforms, transaction systems), automates the data preparation that usually eats most of the project, builds and validates the model, and pushes predictions back into the tools your team uses. No data science team required. The platform handles predictive customer analytics end-to-end, so business users can ask a question and get a trustworthy answer in days, not months.
For a deeper look at how predictions translate into measurable business outcomes, our piece on drive incrementality with predictive analytics walks through the connection in more detail.
What is the main difference between structured and unstructured data?
What are 5 examples of structured data?
What percentage of enterprise data is unstructured?
Can unstructured data be converted to structured data?
Why does the difference between structured and unstructured data matter for AI?
Predictions live in the data you already have
Many companies don’t actually have a data problem. They have a usage problem. Structured records sitting in warehouses, CRMs, and ERPs already contain the signals that predict churn, demand, conversion, and revenue. The hard part is turning those signals into reliable predictions before the moment to act has passed.
That’s what Pecan’s Predictive AI Agent does. It connects directly to your existing structured data through native data integration, prepares and validates the data automatically, and delivers predictions back into the tools your teams already use. No data science team. No multi-quarter projects. Just predictions you can act on. Book a demo and see what your data is already trying to tell you.


Dror is the VP of Data and Analytics at Pecan AI, where he leads the analytics strategy that powers both customer success and Pecan’s own growth. He joined Pecan as Director of Analytics after years of data leadership roles across tech and fintech, bringing a firsthand understanding of what it takes to make data actually useful for business teams.