The Next Best Action Playbook > Chapter 2: Propensity modeling
Propensity modeling: who will act, and when
A propensity is a probability with a deadline. Take the deadline away and “likely to buy” is a description of someone’s character. Put it back and “likely to buy in the next 30 days” is a campaign, with a list, a budget and a date the results come in.
Propensity modeling predicts how likely each individual customer is to take a specific action within a specific window, using a model trained on your own historical customer data. The output is a score between 0 and 1 for every customer, refreshed on a schedule, with the reasons behind it. It’s the second rung of the decisioning ladder: segments told you who your customers are, propensity tells you what each one is about to do.
This chapter is about framing the question well, because that’s where most propensity projects succeed or fail before a model exists. We’ll cover what the model learns from, the three propensities worth building first for a B2C brand, how a score becomes a list your team can act on, and the one thing propensity can’t tell you.
Framing the question: who, doing what, by when
Three words define a propensity model, and all three have to be pinned down before anyone touches data.
Who is the population you’ll score: all active subscribers, players who opened the app in the last 7 days, policyholders with a renewal in the next 90 days. The population decides what “likely” is relative to. A 0.3 among last-week players means something different from a 0.3 among everyone who ever installed.
Doing what is the action, defined as an event your data can see: placed an order, cancelled, upgraded the plan, funded the account, renewed the policy, opened the win-back email. If the event isn’t recorded, you can’t train on it. “Became a loyal customer” is a feeling; “placed a third order” is a label.
By when is the window, counted from the moment you score: the next 24 hours, 7 days, 30 days, 90 days. The window is the part teams skip, and it’s the part that makes the model usable. Change it from 30 days to 12 months and you have a different model with different features, different scores and a different campaign attached.
| Industry | Who | Doing what | By when | Scored at |
|---|---|---|---|---|
| Ecommerce | Customers with at least one order | Place another order | 30 days | Every night |
| Subscription | Active subscribers | Cancel or fail to renew | 60 days | Weekly, and the day after each billing event |
| Gaming | Players active in the last 7 days | Make a first purchase | 7 days | Daily |
| Fintech | Account holders | Set up direct deposit | 90 days | Weekly |
| Insurance | Policyholders with a renewal inside 120 days | Request a quote elsewhere or lapse | By the renewal date | Weekly, from 120 days out |
Notice the last column. The scoring moment (the observation point) matters as much as the window, because the model can only use what was known at that moment. A subscriber scored the day after a billing event looks different from one scored mid-cycle, and the model should be trained on the same rhythm it will run on.

What the model learns from
Every propensity model learns from your past. For every customer at many past observation points, it looks at everything you knew about them at that moment and whether they took the action in the window that followed. Thousands of those examples, across months of history, teach it which patterns came before the action and which didn’t.
“Everything you knew at that moment” is a strict phrase. The features are the customer’s state before the window opened: days since last order, order count in the last 90 days, average basket, the trend in app sessions, email engagement over the last four weeks, number of support contacts, whether the last purchase used a promo, plan tier, tenure, payment history. In B2C, behavior from the last 30 to 90 days carries most of the signal. Demographics help a little. Purchased third-party data almost never earns its cost.
Leakage is the trap in training: a feature that only exists because the outcome already happened. An “order confirmation opened” event is a perfect predictor of purchase and a useless one, because you only have it after the sale. “Cancellation survey submitted” predicts churn the same way. A model with a leaked feature looks brilliant in testing and falls apart in production, and we’ve seen more projects die this way than from any algorithm choice. The fix is procedural: freeze the feature set at the observation point and let nothing from after it in. Our chapter on churn prediction walks through the same discipline for the churn question, where leakage is most tempting.
Validation follows the same logic. Test the model on a later period than it was trained on, never on a random slice of the same months, because the question is whether it predicts the future, and a random slice lets it recognize the past.
The three propensities most B2C brands run
Propensity to buy answers who will purchase, overall or in a specific category, inside the window. It drives cross-sell timing, promo suppression and merchandising emails. It’s the first model for most ecommerce brands, and the lifecycle team’s view of it is in our chapter on propensity to buy and smarter cross-sell.
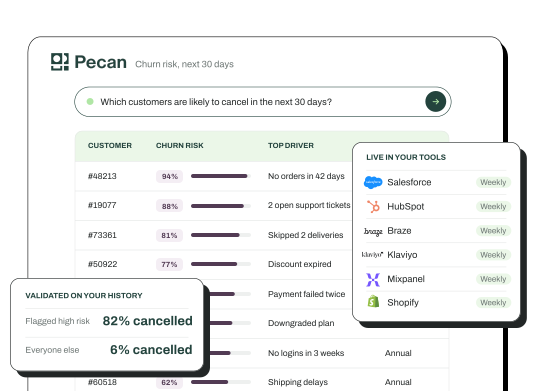
Second comes propensity to churn, which answers who will leave. It drives the retention budget and is the first model for any subscription, gaming or fintech business, because the money lost to churn is usually the biggest number on the growth team’s whiteboard.
The youngest of the three is propensity to respond: who will act because of a specific kind of contact, whether that’s opening the win-back email, redeeming the offer or taking the call. It’s the bridge to uplift, and it only trains well if your campaign history records who got what.
Which first? Follow the budget. If your largest discretionary line is retention offers, build churn. If it’s promotional discounts, build purchase propensity and start suppressing. Most B2C brands end up running all three on every customer, because the next best action for any one customer depends on all three answers at once.
From score to list: capacity, deciles and calibration
Scores become useful when they’re turned into a list, and the list is only as good as where you draw the line.
Picture an ecommerce brand with two million customers and a 4% base rate of buying in any 30-day window, so about 80,000 buyers a month. Score everyone and sort. In a decent model, the top decile (200,000 customers) contains around 28,000 of those buyers, a 14% rate against the 4% base: three and a half times the lift. The bottom decile contains a few hundred. The numbers are illustrative, but the shape, steep at the top and flat at the bottom, is what every well-built propensity model produces.
Now draw the line at capacity. If the team can send 150,000 personalized emails a week, the line sits inside the first decile. If a call center can make 2,000 calls, the line is the top 2,000 scores and nobody else. The threshold is an operational decision, and setting it before the model exists is how you avoid the most common failure in propensity work: a beautiful ranked list that nobody has the capacity to act on.
Two checks keep the list honest. Decile lift is the first: the actual action rate in each decile, measured after the window closes, should fall steadily from top to bottom. If decile 3 beats decile 2, something’s wrong. Calibration is the second: among customers scored 0.30, about 30% should take the action. A model that’s well ranked but badly calibrated will still sort correctly, but every budget calculation built on the scores will be off.

Propensity is necessary and insufficient
Go back to that top decile. Twenty-eight thousand buyers at a 14% rate, and the obvious move is to send them the 15% offer. Most of them were buying anyway. The offer turns a full-price order into a discounted one for the sure things, and the campaign reports a wonderful conversion rate while margin walks out the door.
Remember what a propensity score is: an estimate of what a customer will do. It says nothing about whether your action changes it. The customers worth a discount are the ones in the middle of the ranking, where a nudge tips the outcome, and the customers worth leaving alone are at both ends: the top because they’ll act regardless, the bottom because they won’t act at all. That second model, the one that scores the difference an action makes, is uplift, and it has its own chapter. Build propensity first. Then build uplift before you attach a budget to the list.

Keeping it accurate
Trained once, a propensity model is a snapshot of how your customers behaved during the training period, and customers change. A price increase, a new competitor, a redesigned app, a holiday season: each one shifts the patterns, and a model trained before the shift quietly gets worse. Our explainer on model drift covers how to catch it; the short version is to keep measuring decile lift every cycle and retrain when it flattens.
Refresh cadence should match the window. A 24-hour model scores daily. A 30-day purchase model scores nightly, because customers browse and buy in between. A 90-day churn model can score weekly. Seasonal businesses need seasonal windows: a 30-day purchase model for a toy retailer behaves differently in November, and the honest fix is either to include enough history that the model has seen several Novembers or to run a seasonal variant.
One practical point. Keep the scores in the systems where decisions happen (the ESP, the CRM, the ad platform audience) rather than in a report. A score nobody can act on by Tuesday decays faster than any model.
Two propensity models with unusual deadlines
Deadlines are where the creativity in propensity work lives, and two B2C examples show how far they can stretch.
Take a U.S. wellness services company with hundreds of providers that sells repeat treatments through a call center. Their question had a 30-day window: the models identify the customers most likely to repurchase within 30 days, and the call center worked that list instead of the whole base. The published results: a 12% increase in repurchases, a 35% uplift in sales conversion rate, and $400K of incremental revenue captured within just 2 months.
ShopTJC, a UK jewelry retailer, went the other direction and used a 24-hour window for an operations decision rather than a marketing one. The model predicts whether a customer who made a purchase in the past 24 hours will make another purchase in the next 24 hours, so the warehouse can hold the first parcel and ship both orders together. The result on the page: 2000-3000 shipments saved per month, a 6% decrease in shipping costs. Same model family, a window measured in hours, and a payoff in logistics.
If you’d like a walkthrough of building a purchase propensity model step by step, with a decile table and the data checklist, our post on propensity modeling in practice goes a level deeper on the mechanics.
Where we come in
Framing the question is yours. The model is the part that used to need a data science team, and it’s where we come in, in one sentence: you bring your historical customer data and the question (who, doing what, by when), the Predictive AI Agent reads that data as it is, trains and validates the propensity model with the leakage and calibration checks built in, and we own the outcome, with scores and drivers live in the CRM, ESP or ad platform your team already uses. If the modeling itself is new to you, our explainer on predictive modeling covers how these models are trained and validated.
Predict the right move for every customer:
Book a demoFAQ
What is a propensity score?
A propensity score is a number between 0 and 1 that estimates how likely an individual customer is to take a specific action within a specific window, such as 0.34 for “will place an order in the next 30 days.” It comes from a model trained on your historical customer data, and a well-calibrated score means roughly 34 out of 100 customers scored 0.34 will take the action.
How is a propensity model different from a churn model?
Churn models are one kind of propensity model: they predict the propensity to cancel or lapse within a window. Other common propensities are to buy, to respond to a contact and to upgrade. They share the same structure (a population, an action, a window, an observation point) and differ in the action being predicted.
How often should propensity scores refresh?
As often as the window and the decision require. A 24-hour window scores daily, a 30-day purchase model scores nightly, and a 60- to 90-day churn model can score weekly. The scores should land in the tools where the decision gets made, and decile lift should be checked every cycle so the model is retrained when it starts to drift.