Pecan is a Leader in G2’s Fall 2026 Mid-Market Grid for Predictive Analytics and a High Performer in three more Fall 2026 Grid reports: Predictive Analytics, Data Science and Machine Learning Platforms, and MLOps Platforms.
Every placement comes from verified user reviews that G2 collected through July 28, 2026, and every product on a Grid needs at least ten of them.
Most vendor posts about G2 badges stop at the quadrant. We’d rather show you the numbers behind ours, because a G2 Grid scores two very different things, and only one of them tells you whether a product will work for your team.
How G2 builds a Grid, and which number to read
G2 places every product on two axes. Satisfaction comes from what users say in their reviews. Market presence comes from market share, seller size, and social impact. A product needs a high score on both to land in the Leader quadrant.
So a large vendor with lukewarm reviews can sit above a smaller vendor whose users are happier. That’s fair. G2 is measuring reach, and reach is real. It also means the quadrant answers “who’s big?” while the satisfaction column answers “who do users actually like?” If you’re evaluating software, the second question is the one you’re asking.
We’re a much smaller company than Tableau or SAS, and every report below reflects that. So instead of arguing with the axis we can’t control, we’ll put the satisfaction scores side by side and let you decide what they’re worth.
Fall 2026 by the numbers
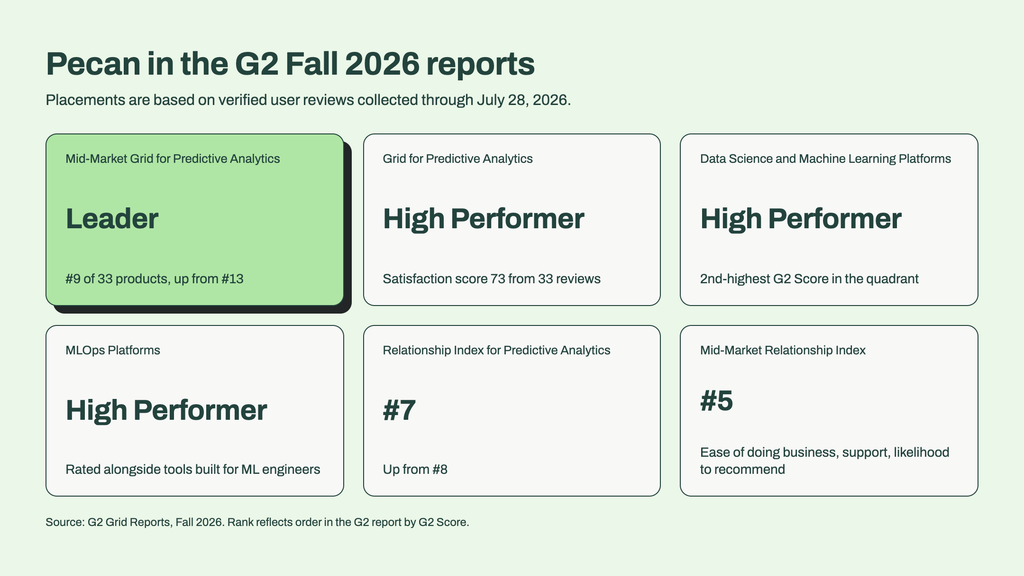
Here’s where Pecan landed across the reports we’re covering in this post.
- Leader, Mid-Market Grid for Predictive Analytics. Ranked 9th of 33 products, up from 13th in the previous report.
- High Performer, Grid for Predictive Analytics. Satisfaction score of 73 from 33 reviews, one of the seven highest satisfaction scores among all 59 products on the Grid.
- High Performer, Grid for Data Science and Machine Learning Platforms. Second-highest G2 Score in the High Performer quadrant.
- High Performer, Grid for MLOps Platforms.
- #7 in the Relationship Index for Predictive Analytics, up from #8, and #5 in the Mid-Market Relationship Index.
Now the part that matters: what each of those means in practice.
Leader in the Mid-Market Grid for Predictive Analytics
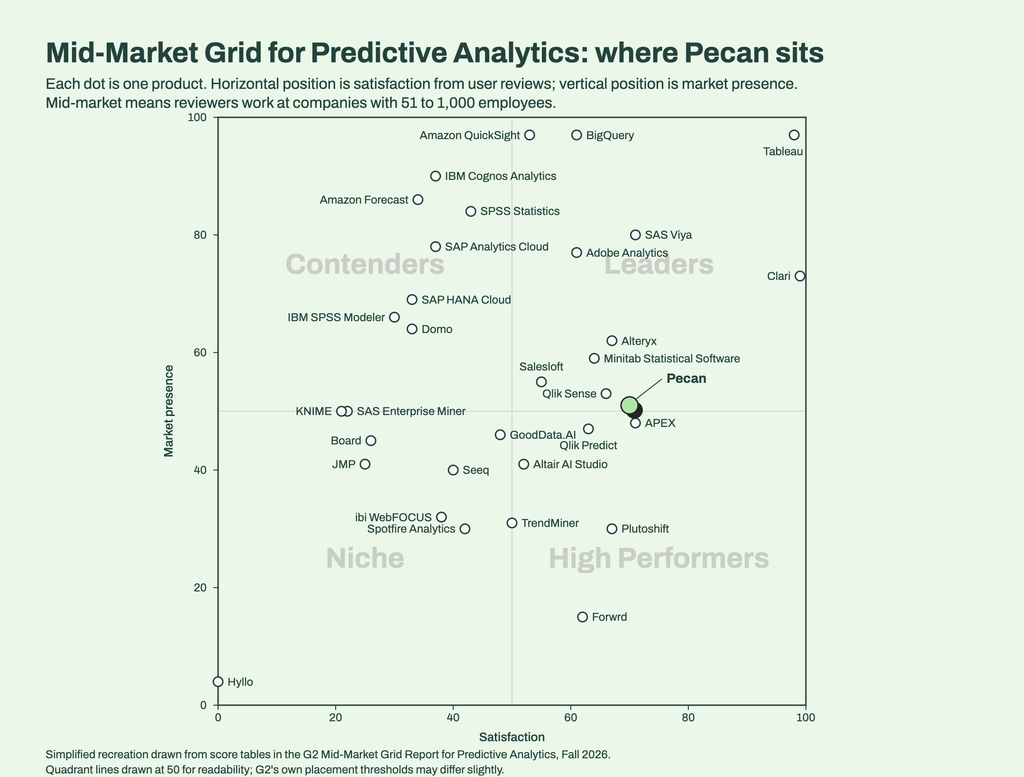
A mid-market reviewer, in G2’s definition, works at a company with 51 to 1,000 employees. For this Grid, G2 keeps only those reviews and rebuilds the whole chart. Pecan lands in the Leader quadrant with a satisfaction score of 70 and a G2 Score of 61, ninth of 33 products and four places higher than last season.
Of the four Grids, we care about this one most, and the reason has nothing to do with the badge.
Mid-market is where predictive analytics gets hard. An enterprise data science team can make almost any tool produce a working model, though it rarely has spare hours for every marketing or operations question. A mid-market team usually doesn’t have that bench. A marketing ops lead at a 300-person subscription brand who wants churn predictions has a warehouse, a CRM, and a deadline. If the tool needs a specialist to catch data leakage or tune a model, the project quietly stalls. So when this segment rates a predictive analytics product, it’s grading whether the product works on its own.
Four products post a higher satisfaction score than Pecan on the mid-market chart: Tableau, Clari, SAS Viya, and APEX. Alteryx (67), Qlik Sense (66), Minitab (64), BigQuery (61), and Adobe Analytics (61) sit below.
To see what those reviewers were rating, the shortest route is our walkthrough of how Pecan turns a business question into a deployed model, and the customer stories from Whistle Express, Hydrant, ShopTJC, and others who did exactly that without hiring a data scientist.
High Performer in the Grid for Predictive Analytics
The main Grid is the one most buyers see first: 59 products, every company size, one chart. On it, Pecan is a High Performer with 33 reviews, a satisfaction score of 73, a market presence score of 46, and a G2 Score of 60.
That satisfaction score is higher than 18 of the 22 products in the Leader quadrant. Alteryx scores 61. Dataiku, 62. Amazon Forecast, 50. IBM Cognos Analytics, 60. Qlik Predict, 61. Only Tableau, Clari, SAS Viya, and Adobe Analytics score higher among Leaders. Across the full Grid, six products score above 73 and one (APEX) ties it.
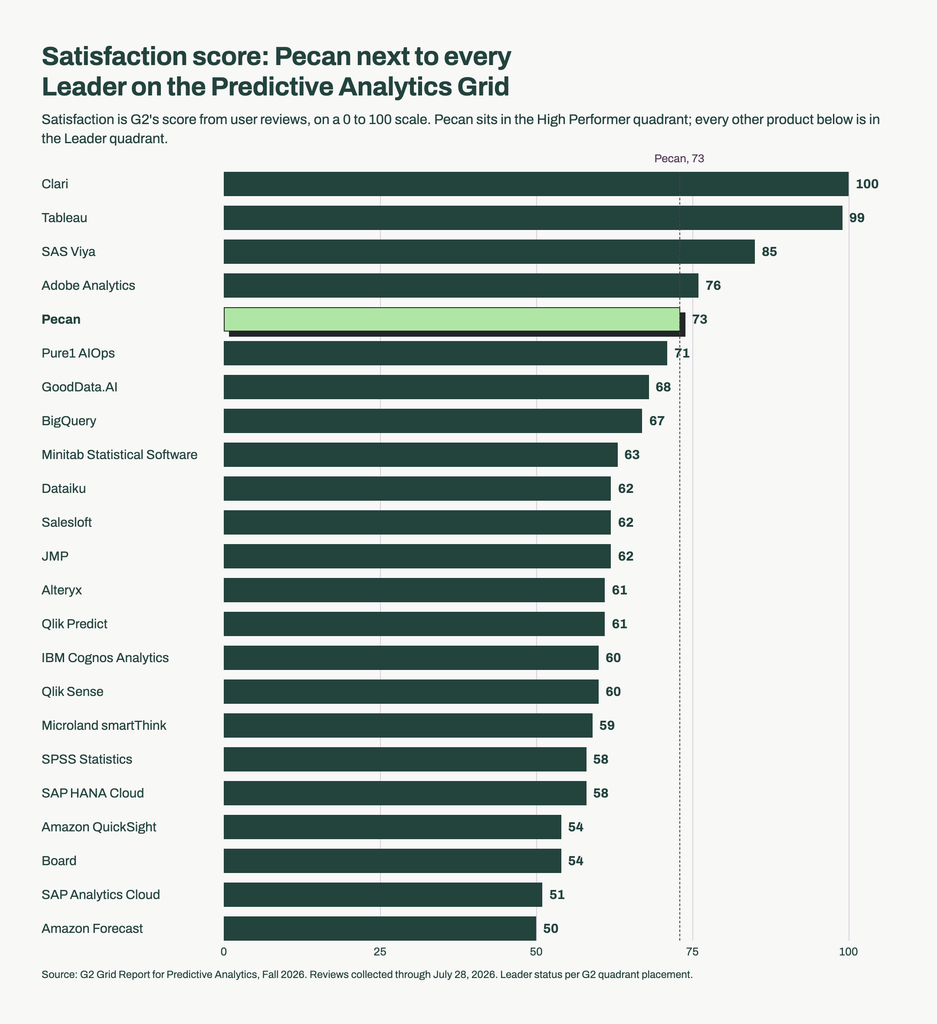
What keeps Pecan out of the Leader quadrant is market presence. We won’t argue with that. The companies above us on that axis employ thousands of people and have been selling analytics software for decades. What we’d point out is simpler: satisfaction is the score you live with after the contract is signed. Market presence is the score that helps you get the purchase approved.
Reviews follow a pattern. People mention that they got to a working model quickly, that support and enablement were unusually hands-on, and that they didn’t need a data science team to do it. A few reviewers want more visibility into model internals, which is fair feedback and one of the reasons every prediction in Pecan ships with its top drivers and a confidence score. You can read all of them, including the critical ones, on Pecan’s G2 profile.
High Performer in Data Science and Machine Learning Platforms
Databricks, TensorFlow, SageMaker, MATLAB, Hex, and Deepnote all live in this category, which tells you who it was built for. Among them, Pecan is a High Performer with the second-highest G2 Score in that quadrant (51, behind Saturn Cloud) and a satisfaction score of 68 that sits above seven of the sixteen Leaders, including Google Cloud AutoML (67), Alteryx (66), TensorFlow (66), and MATLAB (64).
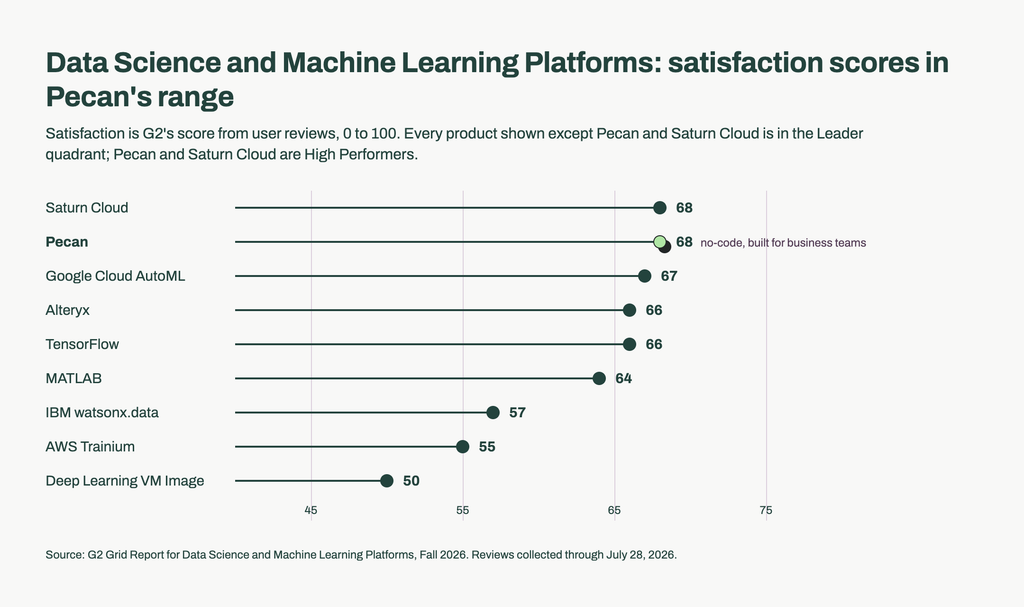
Who did the reviewing is the interesting part. The people who rate products in this category are, mostly, people who could write the model themselves. They compared a no-code agent against the tools they open every morning and put it in the same range. That’s a different kind of endorsement than “easy for beginners.”
Curious how an agent differs from an AutoML platform or a notebook? Our explainer on what a predictive AI agent does across the full modeling cycle covers the distinction in plain language.
High Performer in MLOps Platforms
MLOps is the part of machine learning nobody puts on a slide: deploying a model, watching it drift, retraining it, keeping the predictions flowing into the systems people work in. Most business teams never hear the term because they never get that far. The model dies in a notebook.
Here, Pecan places as a High Performer with a satisfaction score of 53 from 16 reviews. It’s our lowest score of the four Grids, and we’ll say so plainly. It’s also the category that measures the last step of our canonical flow, ASK → AUTOMATE → TRAIN AND VALIDATE → DEPLOY, the step where a churn score or a lead score lands in Salesforce, HubSpot, or the warehouse and stays accurate over time. Being rated at all in a category dominated by tools for ML engineers is the point. The teams reviewing us here aren’t ML engineers, and they’re shipping models to production anyway.
For a concrete picture of what “deploy” looks like for a business team, see how churn predictions land directly in the CRM as automated alerts, or how predictive lead scoring compares with rules-based scoring once the scores are live in the pipeline.
Top ten in both Relationship Indexes
G2’s Relationship Index scores a different set of questions than the Grid: how easy the vendor is to do business with, the quality of support, and how likely reviewers are to recommend the product. On that index, Pecan ranks 7th for Predictive Analytics, up from 8th, and 5th in the mid-market version.
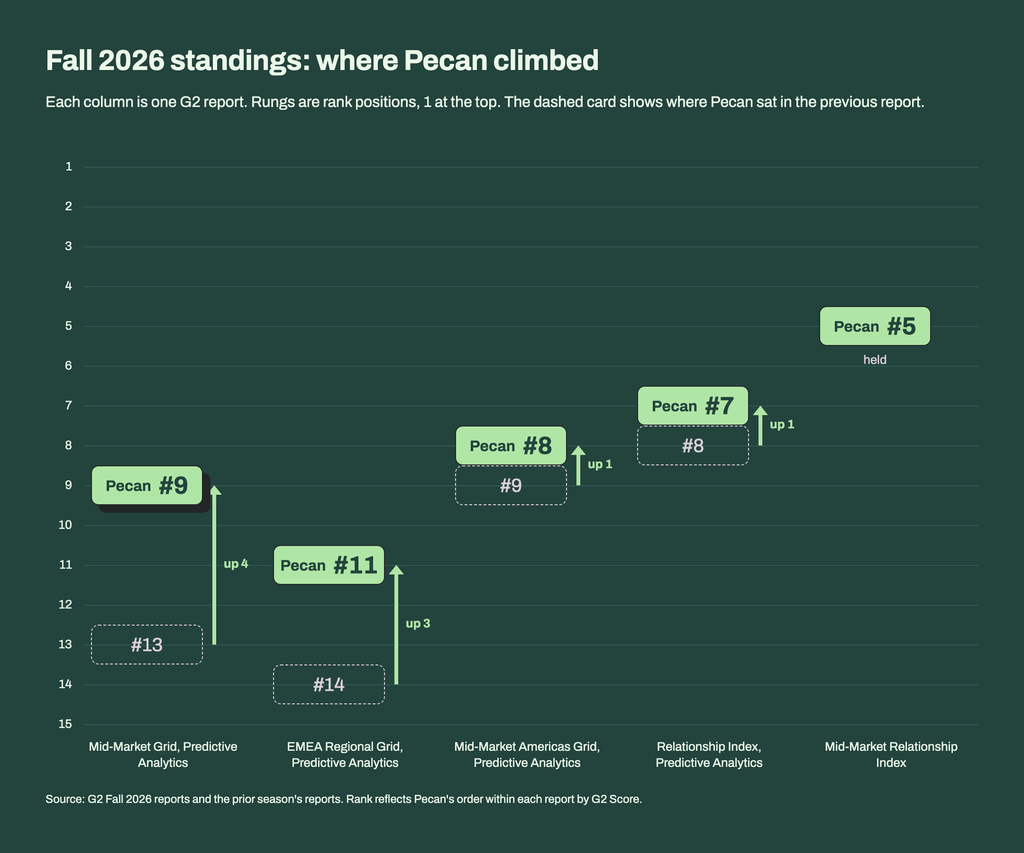
It earns a mention because it explains a pattern in the reviews. Our support and enablement team shows up in a striking number of them, usually by name and usually in the “what do you like best” box. Predictive analytics is a team sport in the first month, and a vendor that disappears after onboarding leaves you with a model and no plan.
How to read any G2 Grid before you buy
Rankings like these are useful to us. They’re more useful to you if they change how you evaluate every vendor, including us. Three habits worth keeping:
- Filter to your company size first. The all-segments Grid blends enterprise reviewers with everyone else. If you’re a 200-person company, the mid-market Grid is your Grid. If you’re larger, filter the reviews on a vendor’s G2 profile by company size, then read the satisfaction scores and the Relationship Index, which show what working with a vendor is like after the contract is signed.
- Sort by satisfaction, then check review count. A 90 satisfaction score from 12 reviews and a 70 from 400 reviews tell very different stories. Pecan’s 33 reviews on the main Grid is a real sample, and it’s also a number we intend to grow.
- Read the dislikes. Every product has them. A vendor’s dislikes tell you what you’ll be living with in month six.
If you do that and Pecan still looks right for your team, book a demo. We’ll walk you through the platform using real use cases like churn, lead scoring, and demand forecasting, and you can decide whether the satisfaction score holds up in person.
Is Pecan a G2 Leader?
What's the difference between a G2 Leader and a High Performer?
How many reviews does Pecan have on G2?
When was the G2 Fall 2026 data collected?
Can vendors pay for placement on a G2 Grid?
Which G2 categories rank Pecan in Fall 2026?
G2 Grid reports are based on user reviews and third-party data. G2 is a registered trademark of G2, Inc. Scores cited are from the Fall 2026 reports and may change as G2 receives new reviews.