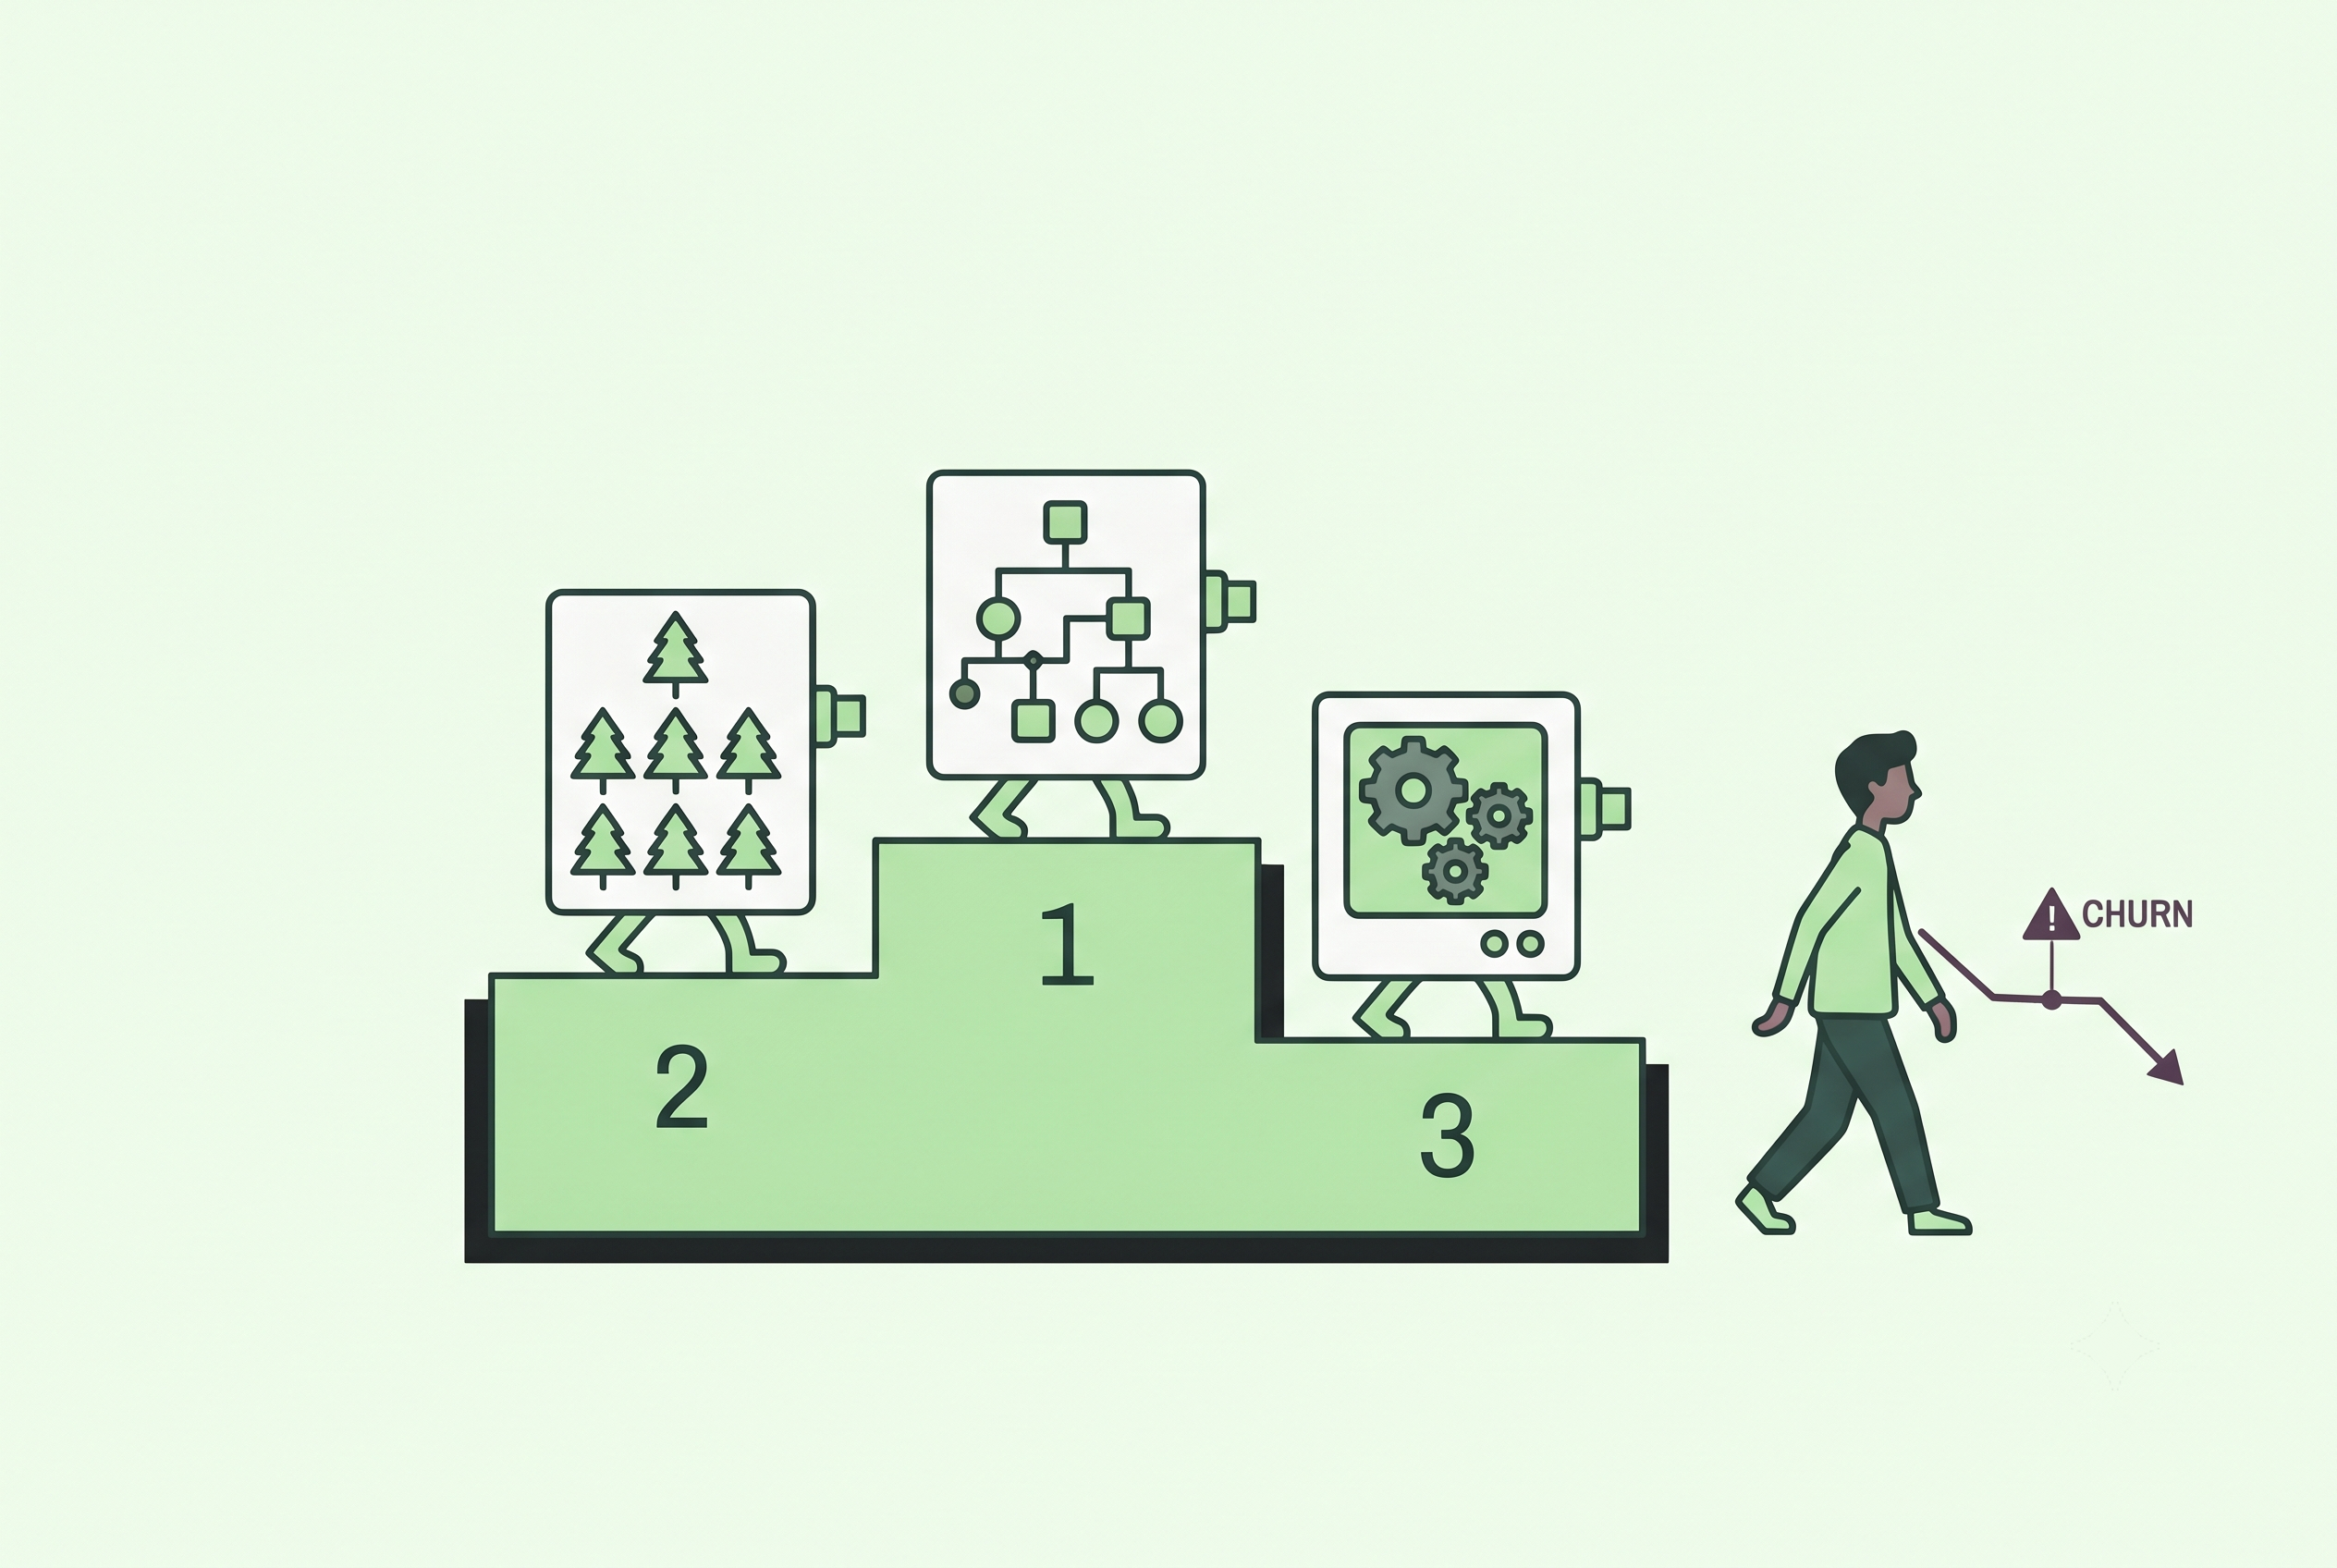
Two teams can build a churn prediction model with the same algorithm and the same data and end up miles apart. One catches at-risk customers a month early. The other ships a model that looks great in testing and predicts almost nothing useful in production. The gap between them has very little to do with whether they chose a random forest or a neural network. It comes down to how they defined churn, how far ahead they tried to predict, which signals they fed the model, and whether anything from the future quietly leaked into the training data.
If you run a subscription product, subscriber churn has its own rhythm worth understanding before you model anything at all.
This article is both an honest comparison of the models and a case for caring less about the choice. We’ll start with the comparison, since you came for it.
The best churn prediction models at a glance
| Model | Setup complexity | Accuracy on churn data | Speed to train | Best for |
| Logistic regression | Low | Decent baseline | Fast | Your first model, explainable and audited settings |
| Decision tree | Low | Moderate, overfits alone | Fast | Quick rules, stakeholder buy-in |
| Random forest | Medium | Strong | Medium | A reliable mid-tier with little tuning |
| Gradient boosting (XGBoost, LightGBM, CatBoost) | Medium-high | Highest on most tabular churn | Medium | Production accuracy on structured data |
| Neural network | High | Strong at scale | Slow | Huge datasets, text and sequence signals |
| Survival model (Cox and ML variants) | Medium | Strong for timing | Medium | Predicting when a customer churns, not just if |
The six models – compared
Logistic regression
The old reliable. It estimates the probability a customer will churn as a weighted sum of their attributes, then squashes that into a 0-to-1 score. Build this first. Every time.
Its coefficients tell you which factors push churn up or down, which makes it easy to explain to a VP who wants to know why. It trains in seconds, rarely overfits, and holds up in audited or regulated settings where you have to justify every prediction.
The ceiling is real, though. Logistic regression assumes mostly straight-line relationships and ignores interactions between features unless you build them by hand. Customer behavior is rarely that polite. Treat it as your baseline and your sanity check, not usually your final churn model.
Decision trees
A decision tree is a flowchart the model writes itself: a series of yes/no splits (“tenure under 3 months?”, “support tickets over 5?”) that end in a churn-or-stay call.
People love them because you can read them. Hand a single tree to a non-technical stakeholder and they’ll follow the logic in a minute. No feature scaling needed, handles non-linear splits, fast to train.
A lone tree is also fragile. It overfits happily, memorizing quirks of your training data, and a small change in the data can flip half its branches. Useful for explaining churn drivers and winning buy-in. Rarely the model you actually deploy on its own.
Random forests
Take that fragile single tree, grow a few hundred of them on random slices of the data, and let them vote. That’s a random forest, and the averaging fixes most of what made one tree unstable.
It’s accurate out of the box, resists overfitting, handles mixed numeric and categorical data, and hands you a clean ranking of which features matter most for churn. For teams that want a strong model without babysitting hyperparameters, this is a good place to land.
The trade-offs: you lose the read-it-at-a-glance clarity of one tree, scoring is slower, and on raw accuracy it usually sits just behind gradient boosting.
Gradient boosting: XGBoost, LightGBM, CatBoost
Boosting also builds many trees, but in sequence, with each new tree correcting the errors of the ones before it. On tabular customer data, which is what churn almost always is, this family wins more often than anything else.
XGBoost is the dependable default. LightGBM is faster on large datasets. CatBoost handles categorical fields (plan type, region, acquisition channel) without much preprocessing. All three are mature and well-documented in 2026.
Worth saying plainly: for ordinary tabular churn data, gradient boosting still tends to beat deep learning, despite the noise around neural nets. The cost is tuning. Boosting rewards careful work and punishes laziness with overfitting, so pair it with honest validation.
Neural networks
Deep learning shines when your churn signal hides in messy, high-volume, or unstructured data. Millions of rows. Clickstream sequences. The text of support tickets. Embeddings from product usage logs. A neural network can find patterns there that trees miss.
For a standard table of customer attributes, though, it’s usually overkill. Neural nets are data-hungry, slow to train, hard to explain, and on plain tabular churn data they often lose to a well-tuned gradient boosting model anyway.
Reach for them when you have real scale and unstructured signals worth mining, plus the team to maintain them. Otherwise the simpler tools will get you there faster and cheaper.
Survival models
Most of the models above answer one question: will this customer churn, yes or no? Survival models (Cox proportional hazards and its machine learning cousins) answer a more useful one for subscription businesses: when?
They model time-to-event, and they handle customers who haven’t churned yet without throwing that information away. That timing matters. Knowing someone is likely to cancel in the next 30 days versus the next 6 months changes what you do about it.
The catch is familiarity. Survival framing is less common on business teams, the tooling is thinner than the classification world, and it asks you to think in hazards and time windows. For subscriber churn, the payoff is often worth the adjustment.
How to choose a churn prediction model
Here’s the honest decision path, and it’s shorter than most vendors want it to be.
Start with logistic regression. Always. It sets a baseline and tells you whether the problem is even learnable from your data. If a simple model already separates churners from stayers reasonably well, good, you have signal worth building on.

For production accuracy on a normal table of customer data, move to gradient boosting. XGBoost or LightGBM will be your workhorse, and for most teams it’s the right final answer. Add a survival model when the timing of churn drives your intervention. Save neural networks for the cases with genuine scale or unstructured inputs.
Notice what this path optimizes for: getting a working churn model into people’s hands, not topping a Kaggle leaderboard. If you want to see how model selection fits the wider picture, our guide to predictive customer analytics covers it.
Why the model is the easy part
Swapping XGBoost for a neural network might move your accuracy a point or two. Getting these next things wrong can sink the whole project.
How you define churn. For a subscription, churn might be a cancellation. For a usage-based product, it’s a gradual fade. Pick the wrong definition and you’ll predict the wrong thing very precisely.
Your prediction window. A model that flags churn the day someone leaves is useless. You need enough lead time to act, which means training the model to predict churn weeks or months ahead, using only data available at that point.
Feature engineering. This is where most of the real accuracy lives. Turning raw logs into signals (trend in logins, drop in feature use, time since last purchase) built from your historical data does more for a churn model than any algorithm swap. Solid customer behavior analysis is what feeds those features.
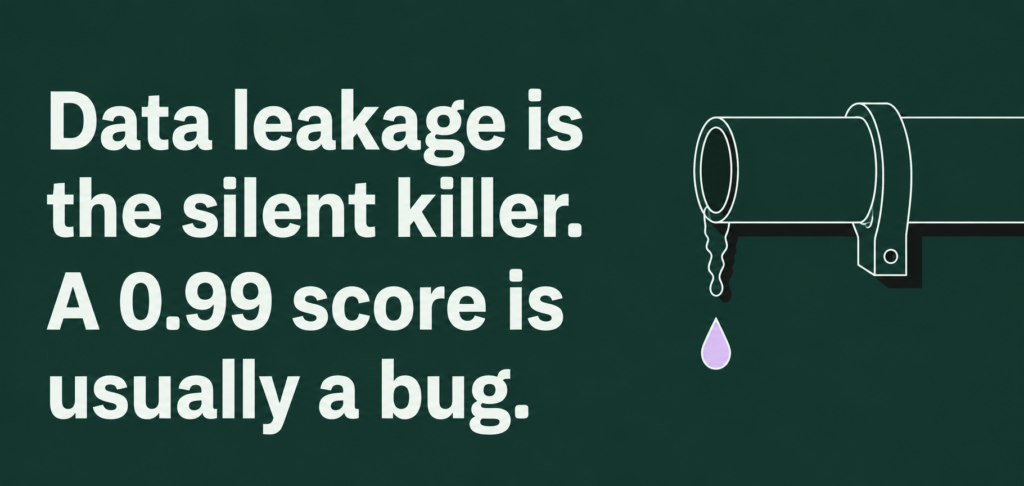
Data leakage. The silent killer. If a feature accidentally encodes the outcome (say, an “account closed” date), your model looks brilliant in testing and falls apart in production. A churn model that scores 0.99 in validation is usually a leakage bug, not a triumph.
Class imbalance. Most customers don’t churn in any given period, so a lazy model can hit 95% accuracy by predicting that nobody leaves. Handle the imbalance or your metrics will lie to you.
Getting these right is the actual work of churn modeling. Our walkthrough on how to implement predictive churn modeling digs into the mechanics.
From customer churn analysis to prediction
There’s a step that comes before any model, and skipping it is why a lot of churn projects stall. Customer churn analysis is the descriptive work: who left, when, and what they had in common. It’s how you spot that churn clusters in the first 60 days, or among customers who never touched a key feature.
Analysis tells you what already happened. Prediction tells you who’s heading there next. You need both. The patterns you find in churn rate analysis become the features and the churn definition your model learns from.
Skip the analysis and you’ll build a technically valid model that predicts something nobody can act on.
Building churn models without a data science team
By now the pattern is clear. The model is the small part. The churn definition, the feature work, the leakage checks, and the deployment, that’s the project. And that’s exactly the part most business teams don’t have a data scientist to handle.
This is the gap Pecan’s Predictive AI Agent fills. You ask a business question (“which customers are likely to churn next quarter?”), and the agent handles the workflow underneath: preparing your historical data, engineering features, selecting and training the model, and validating it. Built-in guardrails check for the exact traps above (data leakage, overfitting, and unbalanced labels) before anything reaches production.
It weighs up to 1,500 signals per prediction, far more than a team would hand-build, and the results land where your people already work, in Salesforce, HubSpot, or your warehouse, with explanations and confidence scores attached. No code. No waiting weeks for a model.
As churn prediction software built for business teams rather than specialists, the approach shows up in the numbers: around 12% average churn reduction across retention deployments, with models reaching production in about a week, up to 32 times faster than traditional data science cycles. For the product view, our customer churn solution lays out how it works in practice.
What actually separates winning retention teams
The teams pulling ahead on retention in 2026 aren’t the ones running the most exotic algorithm. The algorithm question is close to settled: gradient boosting for most tabular churn, survival models when timing matters, neural nets for scale. That part is becoming a commodity, and more of it is automated every year.
The edge has moved. It lives in how fast you can go from a business question to a deployed churn model, how cleanly your predictions reach the people who act on them, and whether you catch at-risk customers early enough to change the outcome. Speed and deployment, not algorithm trivia.

Pick your model, sure. Then spend the rest of your energy on the parts that actually decide whether anyone keeps a customer because of it. When you’re ready to move from prediction to action, our churn reduction playbook and our retention strategy guide are good places to take it next.