pLTV (predicted lifetime value) is a machine learning estimate of the total revenue a customer or cohort will generate over a defined future period, built from the earliest signals of their behavior, such as installs, sessions, and first purchases, so acquisition and retention decisions can happen before the revenue arrives.
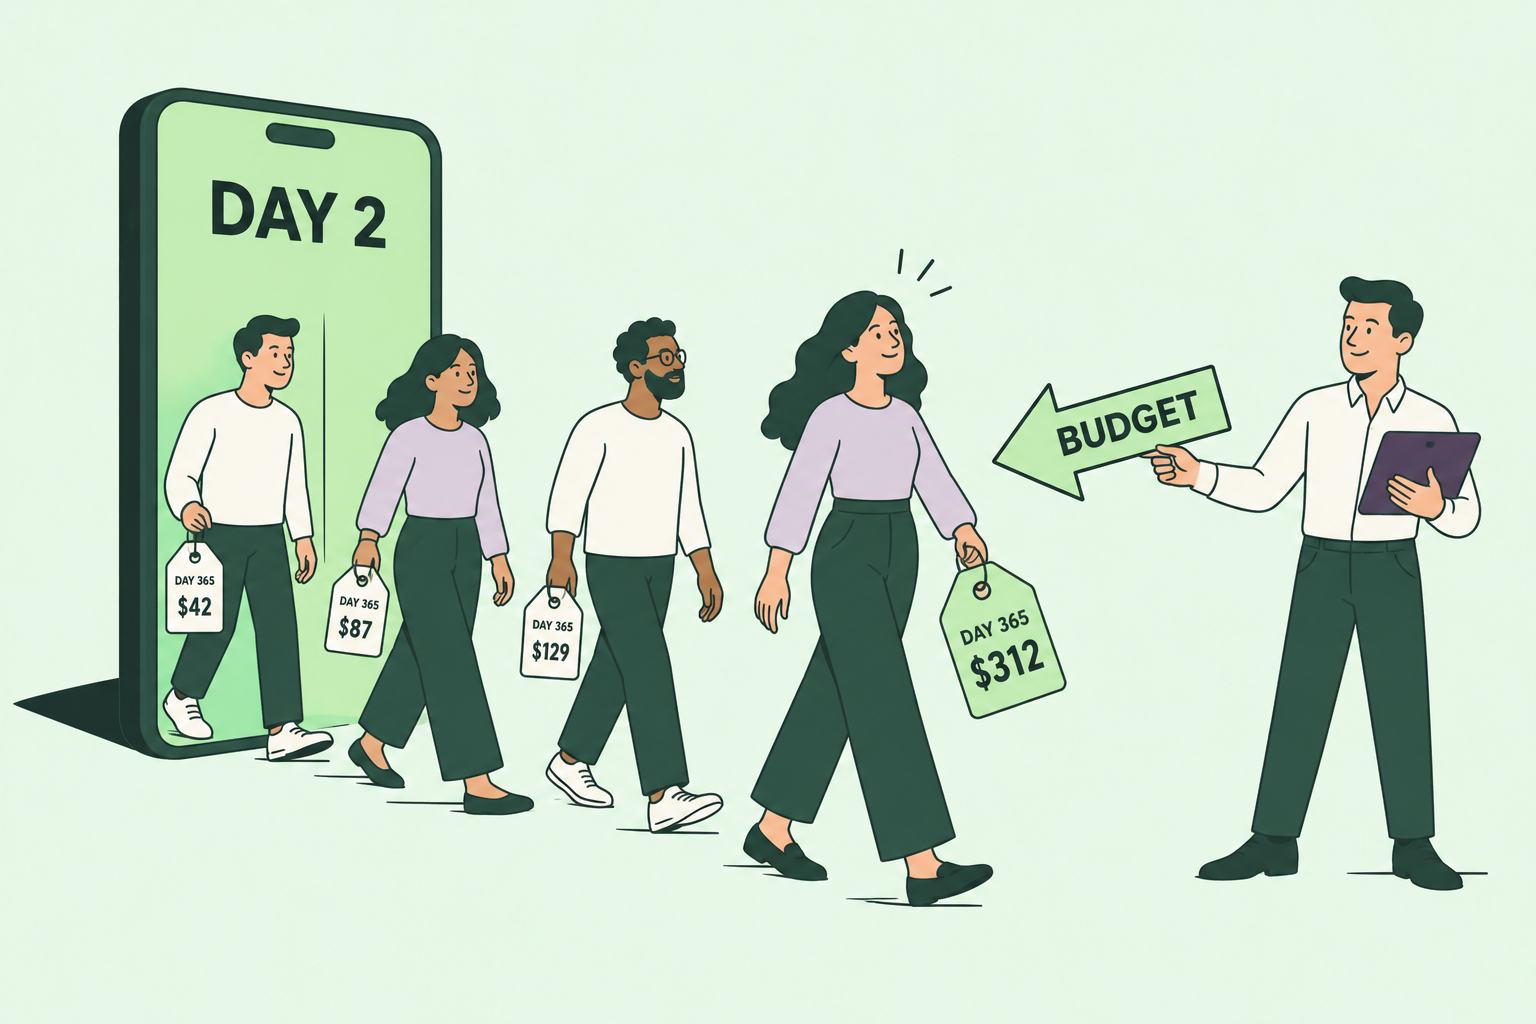
Every user acquisition decision has a deadline, and the number you need to make it shows up months late. A campaign gets scaled or cut by Day 3 or Day 7. The revenue that tells you whether that was the right call lands at Day 90, Day 180, or Day 365. pLTV closes that gap. We’d push the idea one step further: think of pLTV as a clock as much as a metric. The only question it really answers is how much of a customer’s future you can see before your budget decision is due. That framing shapes everything about how you build it, and we’ll show you why.
What is pLTV?
pLTV stands for predicted lifetime value. The “p” marks it as a forecast: a model looks at what a new user did in their first hours or days and estimates what they’ll be worth over a much longer horizon. You’ll see it written as pLTV, predictive LTV, or LTV prediction, and they all mean the same thing.
The term grew up in mobile apps and gaming, where user acquisition (UA) teams buy installs at scale and need to judge campaigns quickly. Mobile measurement partners (MMPs) such as AppsFlyer and Adjust, and the ad platforms themselves, adopted the acronym, which is why it’s the standard shorthand in that world even though ecommerce and SaaS teams often say CLV or CLTV for the same concept.
Each pLTV model produces a number per user (or per cohort, campaign, or channel) and usually a rank alongside it: this new player sits in the top 1% of predicted value, that one in the bottom half. Both the number and the rank matter, because most of the things you do with pLTV involve treating the top of the distribution differently from the rest.

pLTV vs LTV: what the “p” changes
Historical LTV looks backward. You add up what a customer has spent (or the ad revenue they generated) since they arrived, and you get an accounting fact. It’s accurate, it’s auditable, and it’s useless on the day a campaign needs a budget decision, because a customer who installed this morning has an LTV of zero.
Predicted LTV looks forward. It takes that same customer’s first-day behavior, compares it against thousands of past users who behaved similarly at the same age, and estimates where this one is likely to end up. The estimate carries uncertainty, but it arrives when you can still act on it.
Naming gets confusing across industries. Ecommerce and subscription businesses tend to say customer lifetime value (CLV or CLTV), and their prediction windows are often measured in years. Mobile and gaming settled on pLTV because their cadence is different: install volumes are large, campaign decisions happen daily, and the early behavioral signals (session length, level reached, first purchase timing) are unusually rich. If your team works in that world, pLTV is the term everyone will recognize.
We’ve written about the broader discipline of customer lifetime value prediction and about why predicting LTV early beats analyzing it late, so we won’t repeat the CLV formulas here. This post stays with the acronym and the acquisition context where it lives.
How pLTV models work
A pLTV model is a supervised machine learning model trained on history. You take past cohorts that are old enough to have reached the horizon you care about, say Day 90, and you show the model what those users looked like in their first few days. It learns which early patterns preceded high value and which preceded nothing, and then it applies those patterns to users who are still young.
Inputs. Working pLTV models draw on four kinds of data:
- Transaction and monetization data: in-app purchases, subscription starts and renewals, and, for ad-monetized apps, impression-level ad revenue.
- Engagement data: sessions, session length, days active, levels or features reached, and time between sessions.
- Attribution data: acquisition source, campaign, creative, country, device, and OS.
- User profile data where it exists: platform, app version, install date.
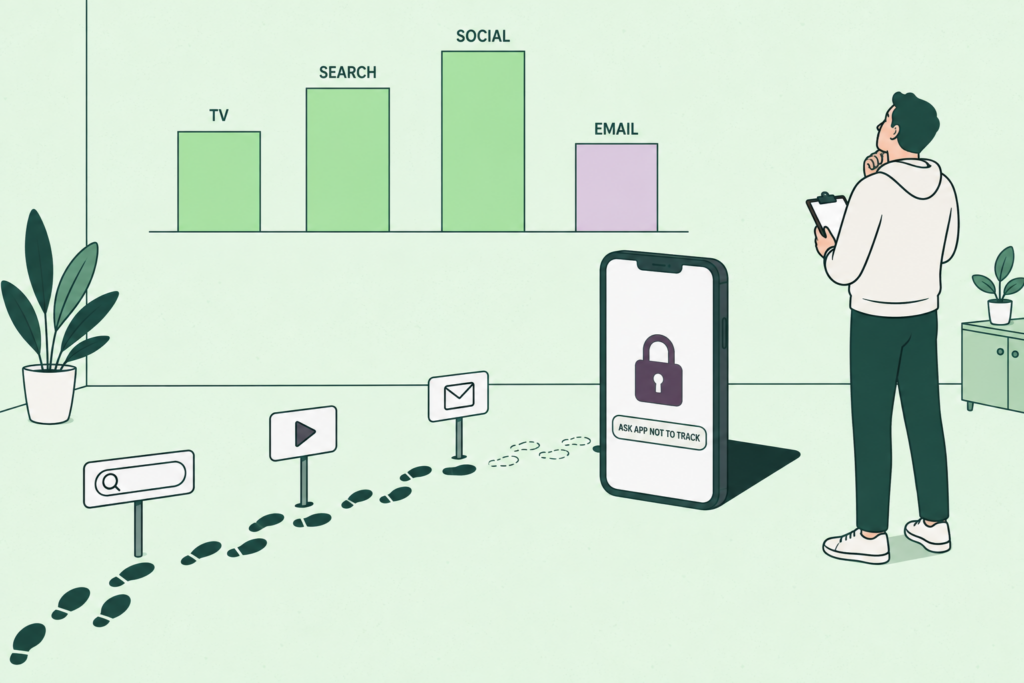
Messy real-world data is normal here. Attribution fields are partial after ATT, revenue arrives on different schedules from different networks, and event names change between app versions. That’s the data these models learn from, so the preparation step matters as much as the algorithm.
Two windows. Every pLTV model is a bet on two time spans: how early you predict, and how far out. The early window is the observation period (the first two days, the first week). The prediction horizon is the outcome (Day 30, Day 180, Day 365). Real deployments make that bet in concrete ways. Mobile studio Pixio built a model that predicts a new player’s lifetime value at Day 30 from their activity by Day 2. Armor VPN uses Day 8 data to predict subscriber revenue by Day 365, with predictions refreshed daily.
Stacked windows. One window rarely covers every decision, so mature teams run several. KSG Mobile runs four pLTV models across different time windows, built on user, engagement, attribution, and revenue data, covering spans from Day 1 to 7 all the way out to Day 60 to 720. The short windows give an early read on whether a campaign is on track; the long windows catch users whose value takes months to show up. A campaign that looks weak on Day 1 to 7 predictions can be projected to hit its target by Day 30, and the team can hold its nerve instead of cutting spend.
Validation and drift. A model that predicted last quarter’s cohorts well can drift as your creative, pricing, or audience changes. Good pLTV setups track predictions against realized revenue as cohorts mature, and retrain when the gap widens. Pecan’s Predictive AI Agent handles the data preparation, feature engineering, training, validation, and monitoring steps automatically, which is why teams without data scientists can run models like the ones above.

What is pLTV used for?
Predictions earn their keep by moving decisions earlier. In UA and growth teams, pLTV feeds four decisions in particular.
Value-based bidding. Ad platforms optimize toward whatever event you send them. Send installs, and you’ll buy installers. Send purchases, and you’ll buy people who buy once. Send a predicted-value event, and the platform’s delivery algorithm starts hunting for users who look like your future high-value customers. In practice, teams map pLTV scores or percentiles to custom conversion events, pass them through their MMP or directly via server-to-server integrations, and run app event optimization or value optimization campaigns against them on Meta, Google, and other networks. This is the use of pLTV that pays off most, because the platform does the targeting work at a scale no manual audience could match.
Budget allocation across channels and campaigns. Comparing campaigns on Day 7 ROAS penalizes anything with a slower monetization curve. Comparing them on predicted Day 180 or Day 365 value puts a subscription funnel and a whale-driven game on the same footing. Armor VPN’s team found a 25% gap on average between the actual lifetime value of acquired users and what they had expected, which is the kind of blind spot that quietly misallocates budget for years.
Spotting late bloomers (and early fades). Some campaigns bring in users who convert slowly but stick around. On Day 7 they look like losers. A pLTV model can flag that those subscribers are projected to become long-term, high-value users, and the right move is to scale rather than pause. The reverse happens too: a campaign with strong Day 1 to 7 numbers can be predicted to underperform on lifetime value, and cutting it early saves the budget.
Tiering for offers and CRM. Splitting new users into high, medium, and low predicted value lets lifecycle teams tailor what each group sees: a generous starter bundle for the top tier, a lighter touch for the middle, no discount at all for users the model expects to churn regardless. A social casino publisher increased ARPU by up to 30% by customizing upsell offers using pLTV, conversion, and churn predictions together.

How UA teams put pLTV into action
Three short examples, each with a different window and a different workflow.
Pixio: Day 2 to Day 30, optimized on Facebook. The Hong Kong studio behind Summoner’s Greed wanted new, high-value players for a game that had been live for three years. Their model predicted Day 30 value from Day 2 activity, and the team built a Facebook app event optimization campaign using custom predictive events aimed at players in the top 1% of pLTV. In lift tests run with Facebook against a business-as-usual campaign optimized on purchase events, the pLTV-informed campaign brought 31% higher revenue per purchase, 18% higher incremental return on ad spend, and 4% lower cost per install.
A mobile game publisher: top 1% predictions, tested with a Conversion Lift Study. Here the workflow ran through the MMP. Each new user received a pLTV prediction and a percentile score; the top 1% were passed to AppsFlyer, then mapped to Facebook server-to-server as custom events. Working with Meta’s gaming and marketing science teams, the publisher ran a four-week Conversion Lift Study on U.S. Android users. The campaign optimizing UA spend with pLTV predictions showed 68% lower cost per incremental install, 2.7x the ROAS of the control group, and 34% higher player spend.
Armor VPN: Day 8 to Day 365, refreshed daily. A subscription business with a longer payback curve needed a longer horizon. Predictions of Day 365 revenue from Day 8 data land in a custom dashboard every day, and the UA team uses them to end campaigns that look strong early but are projected to underdeliver, and to double down on late bloomers. As their marketing executive put it, “We’re able to anticipate within the first few days of a campaign what it will produce in the future, and make adjustments as needed.” Read the Armor VPN story for the full workflow.

How to get started with pLTV predictions
You need three things, and the first is usually already sitting in your warehouse or MMP.
User-level history. Timestamped events (installs, sessions, purchases, ad revenue) joined to attribution fields, going back far enough that older cohorts have reached the horizon you want to predict. If you want Day 180 predictions, you need cohorts that are at least 180 days old to train on. Gaps and inconsistencies are expected. They’re part of what the model learns to work around.
One window tied to a real decision. Pick the horizon you already make decisions against. If your UA team scales or kills campaigns on Day 7, start with a Day 3 to Day 30 or Day 7 to Day 90 model, then add a longer window once the first one is trusted. Starting with the longest possible horizon is the most common mistake we see, because it takes the longest to validate.
Somewhere for the predictions to land. Scores need to flow to the MMP, the ad platform, or the dashboard where budget decisions happen. A prediction nobody sees before Day 7 is just another report.
Pecan’s Lifetime Value models are built to run this way: you ask the question in plain language, the Predictive AI Agent prepares the data, trains and validates the model, and pushes the predictions where your team already works. If you’d like to see what your existing data could predict, book a demo and we’ll walk you through it.
What is pLTV?
What does pLTV stand for?
How is pLTV calculated?
What is the difference between pLTV and LTV?

Omer is a Data Scientist at Pecan AI with an M.Sc. in Industrial Engineering, bringing a strong analytical foundation built across multiple industries. He combines structured problem-solving with cross-disciplinary collaboration to drive meaningful impact through data.