You’ve already done AI data analysis. At some point in the past year you dropped a CSV into ChatGPT, asked it what was going on, and got back a decent chart and a few observations. That experiment is exactly why the question has changed. Nobody’s asking whether artificial intelligence for data analysis works anymore. The real question is which parts of the analytics workflow you should hand over, and in what order. Most advice obsesses over picking the right tool. In our experience, the order you automate in matters more than the tool you pick.
Let’s start with the short answer.
AI data analysis uses machine learning and language models to automate the steps of the analytics workflow: preparing data, exploring it, building predictive models, and monitoring results. Instead of performing each step manually, analysts define the question and review the output while AI handles the repetitive work in between.

What is AI data analysis?
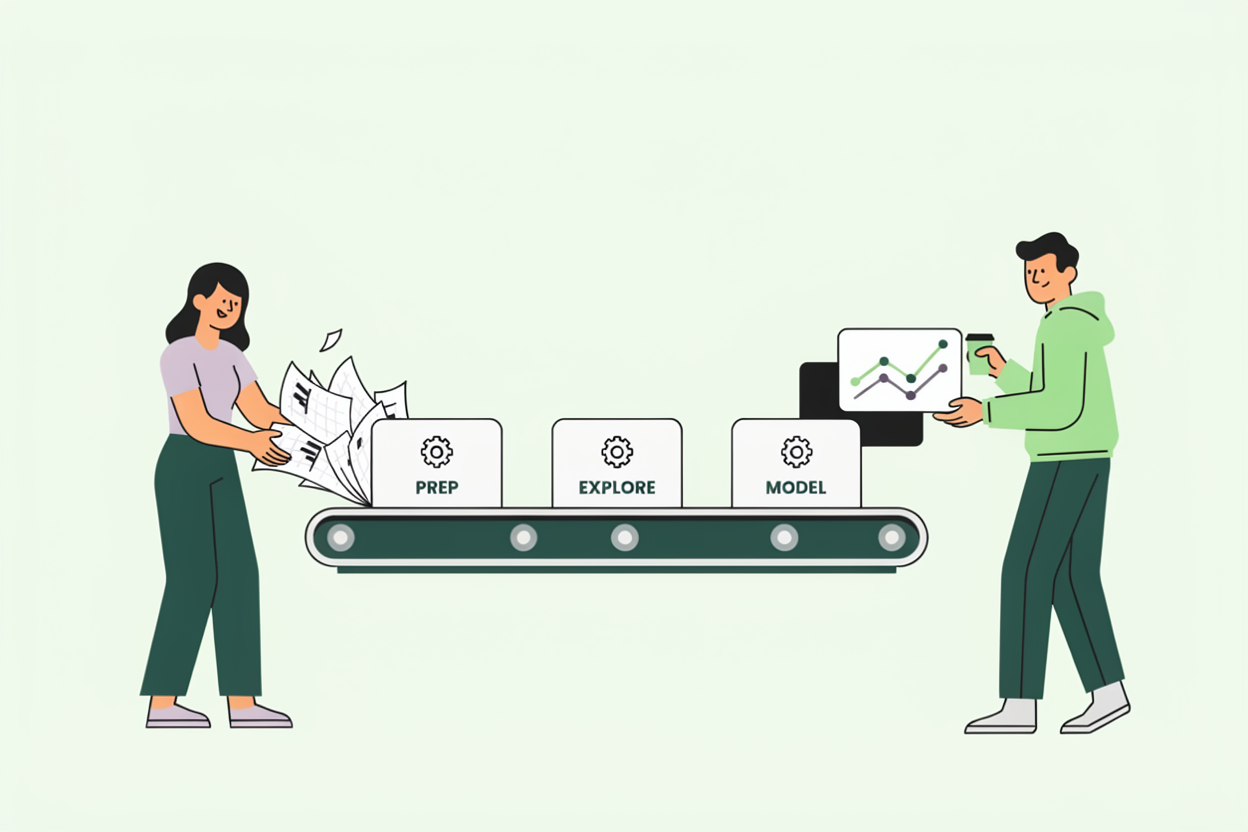
Artificial intelligence for data analysis means putting machine learning and language models to work on the mechanical parts of analytics. The workflow itself hasn’t changed in twenty years: collect and clean data, explore it for patterns, model it to answer a question, then keep an eye on whether the answer still holds. What’s changed is how much of that sequence a machine can now run on its own.
The distinction that matters is between AI that assists a step and AI that owns a step. A copilot that suggests a SQL query assists. A system that ingests raw tables, resolves duplicates, engineers features, trains a model, and validates it against a holdout set owns the step. Both are useful. They solve different problems, and mixing them up is how teams end up disappointed.
One more thing worth saying plainly: asking a chatbot about your data covers a single slice of AI data analysis, through one interface. The full picture is bigger, and the biggest gains sit in the unglamorous stages nobody demos on stage.
The three ways to do AI data analysis today
In 2026 you have three realistic options, and they’re complements more often than competitors. Here’s an honest read on each.
Chat assistants (ChatGPT, Claude, Gemini). Upload a file, ask questions, get charts and summaries in seconds. For ad hoc exploration on a small dataset, nothing beats the speed. What stays manual: everything that makes analysis trustworthy at scale. Chat tools work on samples, not your warehouse. They don’t validate models against holdout data, they can’t schedule themselves to rerun tomorrow, and their output quality depends heavily on the questions you ask. We’ve written about how LLMs and data analytics actually fit together, and the short version is that language models are excellent connective tissue and poor prediction engines. There are also real risks in using ChatGPT for data analysis without guardrails, data leakage being the quiet one that produces confident wrong answers.
BI copilots (Power BI Copilot, Tableau’s AI features). These live inside the dashboards your company already uses. They automate query writing and visualization, and they’re genuinely good at “show me revenue by region as a bar chart” moments. What stays manual: everything upstream and downstream. The copilot inherits whatever data quality your pipelines deliver, and it describes what happened rather than predicting what will. If your dashboards are built on messy data, the copilot just helps you look at the mess faster.
End-to-end predictive platforms (Pecan, DataRobot). These automate the whole workflow around a specific business question: data preparation, feature engineering, model building, validation, and deployment into tools like Salesforce or HubSpot. This is our category, so weigh our bias accordingly. What stays manual even here: deciding which question is worth predicting, and acting on the answer. No platform automates judgment. The trade-off compared to chat tools is setup: you connect real data sources rather than dragging in a file, which takes more effort on day one and pays it back every day after.
Most teams end up running two of the three. Chat for quick questions, a platform for the predictions that touch revenue.
Step 1: Automating data preparation
Preparation is where analytics projects go to stall. Across the customer projects we see, data preparation consumes well over half of total project time before any automation is in place, sometimes closer to two thirds. After automation, it drops to a small fraction of the project, mostly review rather than hands-on cleanup. That gap is the single biggest reason to automate this step first.
What automated prep actually does: it profiles incoming tables, flags and resolves duplicates, handles missing values with methods appropriate to each column, standardizes formats, and joins sources on the right keys and time windows. Modern systems also run data quality checks continuously instead of once, which matters because data doesn’t decay on a schedule.
Integration deserves its own sentence. Connecting sources used to mean engineering tickets and brittle scripts. Automated pipelines now maintain those connections, so the “swivel chair” routine of exporting from five platforms into one spreadsheet can finally retire.

Step 2: Automating exploration and reporting
Exploration is the step chat tools handle best, and it’s a fair place to hand work over. Automated exploration surfaces distributions, outliers, correlations, and data drift without an analyst clicking through forty pivot tables. The win here is coverage. A person explores where their hunches point. A machine explores everything, then shows you the ten things worth a human look.
Reporting is the quieter win. Any report you produce on a schedule, weekly performance summaries, monthly cohort updates, channel breakdowns, is a candidate for full automation. The pattern is simple: if the analysis is the same and only the data changes, a machine should run it. Analysts we work with tend to underestimate how many hours a month this recovers because the work arrives in twenty-minute chunks that never feel worth fixing individually. Add them up over a quarter and it’s a hiring decision.
One caution: automated exploration finds patterns, and patterns are cheap. Deciding which patterns mean something still belongs in the next section about humans.
Step 3: Automating predictive modeling
Modeling is the step with the most mystique and, honestly, the most mature automation. AutoML has been testing algorithms and tuning parameters for years. The newer development is automating what surrounds the algorithm: automated feature engineering turns raw columns like signup dates and transaction logs into the behavioral signals a model can actually learn from, which in business data matters more than the choice of algorithm. Validation is automated too, with guardrails against leakage, overfitting, and imbalanced labels, the three classic ways a model looks brilliant in training and fails in production.
The speed difference is not subtle. One grocery delivery company needed SKU-level demand forecasts across 26 cities and more than 12,000 suppliers, a project their team couldn’t scale in-house. Using automated modeling they deployed models 10x faster, forecast half of their highest-value SKUs with under 20% prediction error, and cut overstock instances by orders of magnitude. The accuracy matters, and the timeline matters more: it shrank from a quarters-long project to weeks, which changed which questions were worth asking at all.

What to automate first
If you’re staring at the whole workflow wondering where to start, here’s the priority order we’d give a team with no automation today, based on where customers get value fastest:
- Data preparation. It’s the biggest time sink, it’s the least satisfying work, and errors here poison everything downstream. Automating prep also forces you to fix the source problems you’ve been working around by hand.
- Repetitive reporting. Same analysis, new data, every week. Zero judgment required to automate, immediate hours back.
- Predictive modeling. The biggest business upside, and it depends on the first two being solid. A model built on manually prepped data inherits every shortcut you took at 6pm on a Friday.
Notice what’s not on the list: exploration for its own sake. Automate exploration when it serves a question, and skip building an insight machine that nobody asked for. Automated insights with no owner become the new unread dashboard.
What still needs a human
This part hasn’t changed much, and we’d rather be honest about it than pretend the machines run the show. Humans still own four things.
Framing the question. “Which customers will churn in the next 90 days” is a modelable question. “Why is revenue down” is a conversation. Knowing which is which, and translating a vague executive worry into a precise predictive target, is the highest-value skill an analyst has, and it’s why the AI data analyst role looks more like a translator than an operator.
Judging context. A model will happily learn from a promotion-distorted quarter unless someone who was in the room says “exclude March, we ran a half-off sale.”
Making the call. Predictions inform decisions. They don’t make them. A churn score of 0.87 doesn’t tell you whether the save offer is worth the margin hit.
Owning the consequences. When the forecast drives an inventory order, someone signs it. That someone is not a model.

Can AI do data analysis?
What is the best AI for data analysis?
Can AI replace data analysts?
How do you automate data analysis?
Automate your first analysis this week
The fastest way to understand what full workflow automation feels like is to watch it run on a question like yours. Book a demo for a guided walkthrough of the platform, and we’ll map the walkthrough to the prediction your team needs first, whether that’s churn, demand, or campaign response.

Dror is the VP of Data and Analytics at Pecan AI, where he leads the analytics strategy that powers both customer success and Pecan’s own growth. He joined Pecan as Director of Analytics after years of data leadership roles across tech and fintech, bringing a firsthand understanding of what it takes to make data actually useful for business teams.