Tabular foundation models like TabPFN promise to change how predictive models get built. Instead of training a model on your data, you hand a pre-trained one your labeled rows and it predicts the rest in seconds, with no tuning, no training run and, by its makers’ benchmarks, accuracy that matches or beats carefully tuned gradient-boosted models. The implied promise is that the hard part of machine learning is solved.
For churn prediction (and many other real-world use cases), it isn’t. TabPFN needs a single, correctly built table, and churn data never arrives that way. It’s spread across subscriptions, logins, usage, support tickets and payments, each recorded on its own schedule, with no churned column anywhere. Turning that into something a model can read is where churn projects succeed or fail, and it’s the part TabPFN leaves entirely to you.
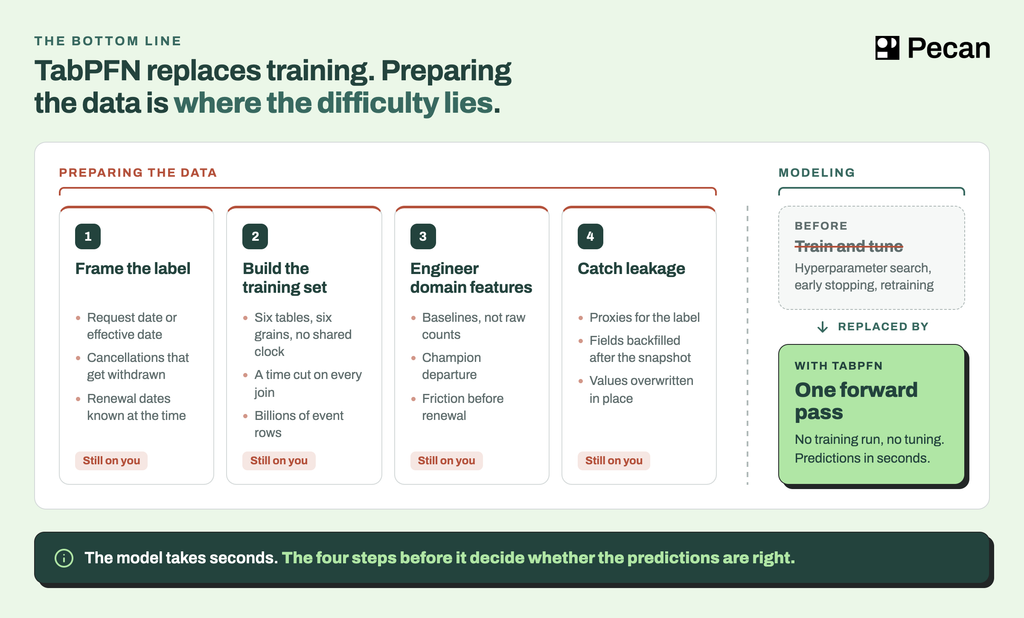
Below, we walk one churn problem through four challenges: framing the label, turning six related tables into a valid training set, building domain features, and catching leakage. None of them is data cleaning. All four take judgment.
What is TabPFN?
TabPFN (Tabular Prior-data Fitted Network) is a transformer pre-trained once on millions of synthetic datasets. It reads your labeled rows as context and predicts the unlabeled ones in a single forward pass, without training on your data. The first paper appeared in 2022; the current release is TabPFN-3.5, from September 2026.
Calling fit() prepares your labeled data for inference without training the model’s weights on your dataset. The quality of the table is the quality of the prediction.
Where TabPFN shines
TabPFN-3.5 ranks first on TabArena and beats tuned XGBoost and CatBoost. Six strengths stand out.
No training, no tuning. No hyperparameter search and no early stopping to babysit.
Calibration. Every row gets a probability. The gap between 0.55 and 0.92 decides where budget and attention go.
Robust to messy inputs. Noise and missing values go in without imputing or scaling first.
Small datasets. It does its best work when labeled data is scarce: a few hundred customers, a new product line, a recently launched market. That’s exactly where tree-based models tend to overfit.
Regression with uncertainty. It predicts numbers like revenue or lifetime value, not just yes-or-no outcomes, and returns a full distribution for each, so you get a range along with the point estimate.
Mixed column types. Numeric and categorical columns go in as they are, with no one-hot encoding, and TabPFN-3.5 adds text columns.

The test case: churn prediction, every month, for every customer
One question runs through the rest of the article: at the end of each month, for every active customer, will they cancel their paid subscription within the next 30 days?
For our example, let’s assume the raw data lives in six tables, each at its own grain and on its own clock. There’s no churned column: cancellations and renewals sit in an event log, so the label has to be built. Each table below shows a few sample rows.
customers (one row per customer)
| customer_id | signup_date | plan_tier | seats | auto_renew_enabled | account_status |
|---|---|---|---|---|---|
| C-1042 | 2025-03-14 | Growth | 25 | true | active |
| C-1187 | 2025-06-02 | Starter | 5 | false | cancelled |
| C-1203 | 2025-09-20 | Enterprise | 120 | true | active |
subscription_events (one row per contract event: start, renewal, cancellation request, withdrawal)
| sub_event_id | customer_id | event_type | event_date | effective_date | term_months | recorded_ts |
|---|---|---|---|---|---|---|
| S-201 | C-1042 | started | 2025-03-14 | 2025-03-14 | 12 | 2025-03-14 08:00 |
| S-202 | C-1042 | renewed | 2026-03-14 | 2026-03-14 | 12 | 2026-03-14 02:10 |
| S-310 | C-1187 | started | 2025-06-02 | 2025-06-02 | 12 | 2025-06-02 10:15 |
| S-311 | C-1187 | cancel_requested | 2026-04-10 | 2026-06-02 | null | 2026-04-10 17:22 |
| S-312 | C-1187 | cancel_withdrawn | 2026-04-15 | null | null | 2026-04-15 09:03 |
| S-313 | C-1187 | cancel_requested | 2026-05-28 | 2026-06-02 | null | 2026-05-29 09:12 |
| S-420 | C-1203 | started | 2025-09-20 | 2025-09-20 | 12 | 2025-09-22 11:05 |
logins (one row per login)
| login_id | customer_id | user_id | login_ts |
|---|---|---|---|
| L-88120 | C-1042 | U-7 | 2026-04-03 09:12 |
| L-88121 | C-1203 | U-55 | 2026-04-03 09:58 |
| L-88122 | C-1187 | U-31 | 2026-04-03 11:40 |
| L-88123 | C-1042 | U-12 | 2026-04-04 16:05 |
usage_events (one row per action in the product)
| event_id | customer_id | user_id | event_type | event_ts |
|---|---|---|---|---|
| E-50211 | C-1042 | U-7 | report_exported | 2026-04-03 09:30 |
| E-50212 | C-1203 | U-55 | dashboard_viewed | 2026-04-03 10:02 |
| E-50213 | C-1187 | U-31 | settings_opened | 2026-04-03 11:41 |
support_tickets (one row per ticket)
| ticket_id | customer_id | opened_ts | closed_ts | priority | csat | retention_code |
|---|---|---|---|---|---|---|
| T-3301 | C-1187 | 2026-04-11 | 2026-04-15 | high | 2 | RET-OFFER-20 |
| T-3302 | C-1042 | 2026-04-12 | 2026-04-12 | low | 5 | null |
| T-3303 | C-1187 | 2026-04-24 | 2026-05-28 | high | null | RET-ESCALATE |
payments (one row per invoice attempt)
| payment_id | customer_id | invoice_date | amount | status |
|---|---|---|---|---|
| P-9120 | C-1042 | 2026-04-01 | 2,400 | paid |
| P-9121 | C-1187 | 2026-04-01 | 300 | failed |
| P-9122 | C-1187 | 2026-04-08 | 300 | failed |
| P-9123 | C-1187 | 2026-04-15 | 300 | paid |
TabPFN takes one table, so the six have to become this: one row per customer per month, with a label that looks 30 days ahead.
The label, cancels_next_30d, is 1 when the customer files a cancellation request in the 30 days after the snapshot and doesn’t withdraw it. It’s dated by the request, not by the day the subscription ends. A label becomes final once its 30-day window has closed and any request in it has reached its effective date without a withdrawal. A row exists only for customers with no open cancellation request on record as of the snapshot date.
Flattened training set (one row per customer per month, as of the snapshot date)
| customer_id | snapshot_date | tenure_months | seats | logins_30d | logins_vs_baseline | value_events_per_seat_30d | active_users_per_seat | champion_departed | tickets_pre_renewal_60d | failed_payments_pre_renewal_60d | days_to_renewal | cancels_next_30d (label) |
|---|---|---|---|---|---|---|---|---|---|---|---|---|
| C-1042 | 2026-04-30 | 13 | 25 | 41 | 1.05 | 2.8 | 0.88 | 0 | 0 | 0 | 318 | 0 |
| C-1187 | 2026-02-28 | 8 | 5 | 19 | 1.15 | 1.6 | 0.80 | 0 | 0 | 0 | 94 | 0 |
| C-1187 | 2026-03-31 | 9 | 5 | 11 | 0.65 | 1.0 | 0.60 | 1 | 0 | 0 | 63 | 0 |
| C-1187 | 2026-04-30 | 10 | 5 | 6 | 0.38 | 0.4 | 0.40 | 1 | 2 | 1 | 33 | 1 |
| C-1203 | 2026-04-30 | 7 | 120 | 212 | 0.97 | 1.9 | 0.71 | 0 | 0 | 0 | 143 | 0 |
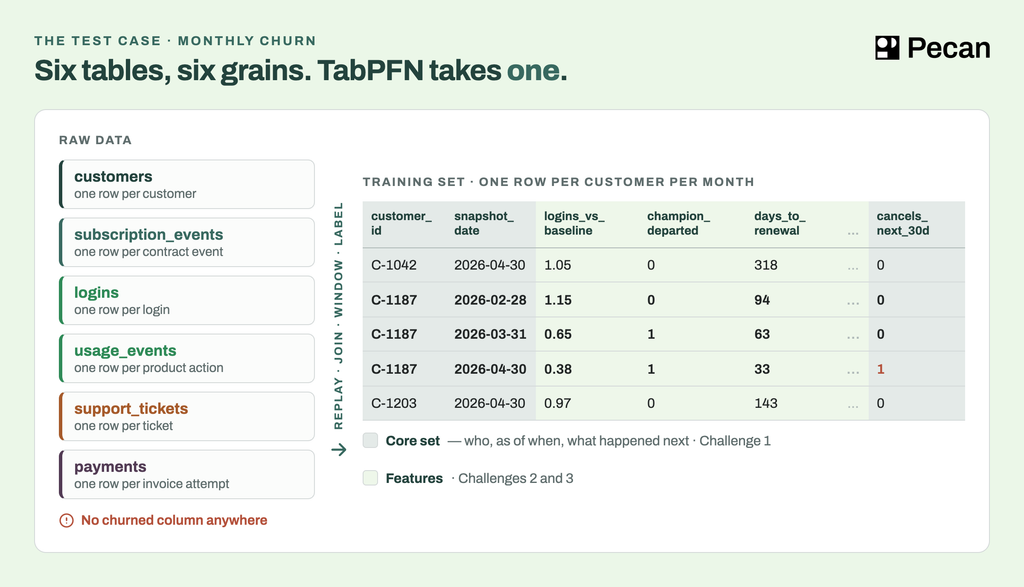
customer_id, snapshot_date and the label are the core set: who, as of when, and what happened next. Every model needs them. Everything between them is a feature. The core set is Challenge 1; the features are Challenges 2 and 3.
Read C-1187’s rows and you can watch the customer leave: logins against their own baseline fall from 1.15 to 0.38, active seats drop from four of five to two, the champion goes quiet in March, and friction piles up as renewal nears. The label flips only in the last row: the April 30 row is 1 because of the May 28 request, which reached its June 2 effective date without a withdrawal. The March row reads 0 even though C-1187 asked to cancel on April 10, because that request was withdrawn. By May 31 the May 28 request is on record (it arrived May 29), so there’s no May 31 row.
Everything TabPFN will know about your customers is in that last table. Getting there from the first six is the work, and it splits into four challenges.
Challenge 1: Framing the question and building the label
The label starts from the customer timeline. A customer signs up, uses the product, reaches a renewal date, and stays or cancels. The training set snapshots that timeline at each month-end and asks a yes-or-no question about the next 30 days. But nobody hands you the timeline. It has to be rebuilt from subscription_events, and almost every step of that rebuild hides a decision. The figure below shows the timelines of three customers from our sample.
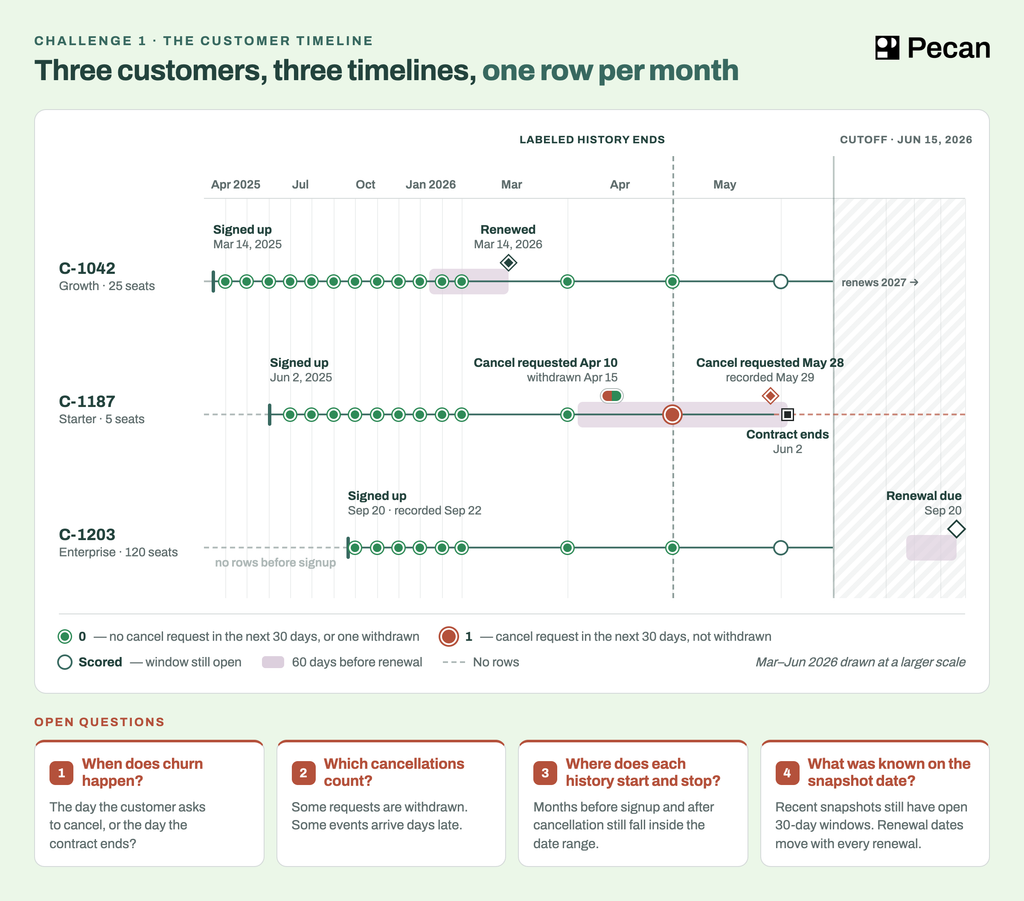
Does churn mean the day C-1187 asked to cancel, or the day its contract ended? Does a cancellation the customer later withdrew count? What about events that reached the warehouse days after they happened, snapshot months that fall before a customer signed up or after it left, and recent snapshots whose 30-day window hasn’t closed yet? We’ve seen each of these go wrong in real churn prediction projects. None has a universal answer, and every answer changes which rows exist or which are positive.
Request date or effective date. A customer can ask to cancel weeks before the contract actually ends. Key the label on the request and one snapshot is a churner; key it on the effective date and that same snapshot is a stayer, with the churn landing in a later snapshot. Neither is wrong: one marks when the customer decided, the other when the revenue stops. The choice also decides where each customer’s rows stop and how many positives the set holds. Same customer, same events, two different training sets, and TabPFN will fit either one without complaint.
Cancellations that don’t stick. Customers ask to cancel, take a retention offer and withdraw. The save often shows up in another table too, such as a retention code on a support ticket, a column that comes back in Challenge 4. Count every cancellation request and customers who stayed get labeled as gone. Pairing each withdrawal with the request it reverses sounds mechanical until the log stops being tidy: a second request filed before the first resolves, a withdrawal logged after the effective date, a request whose withdrawal never made it into the table. Each one is a judgment call about who churned.
Renewal-date leakage. There’s no renewal_date column to trust, so it has to be computed from the log: the latest start or renewal, plus its term. The trap is which “latest”. Take the latest event in the whole log and a snapshot from last year gets a renewal date that only exists because the customer later renewed. Every days_to_renewal value built on it quietly knows how the story ended, and validation looks better for it. Late events and back-dated renewals keep shifting the answer for months that already looked settled.

Challenge 2: Turning relational data into a valid training set
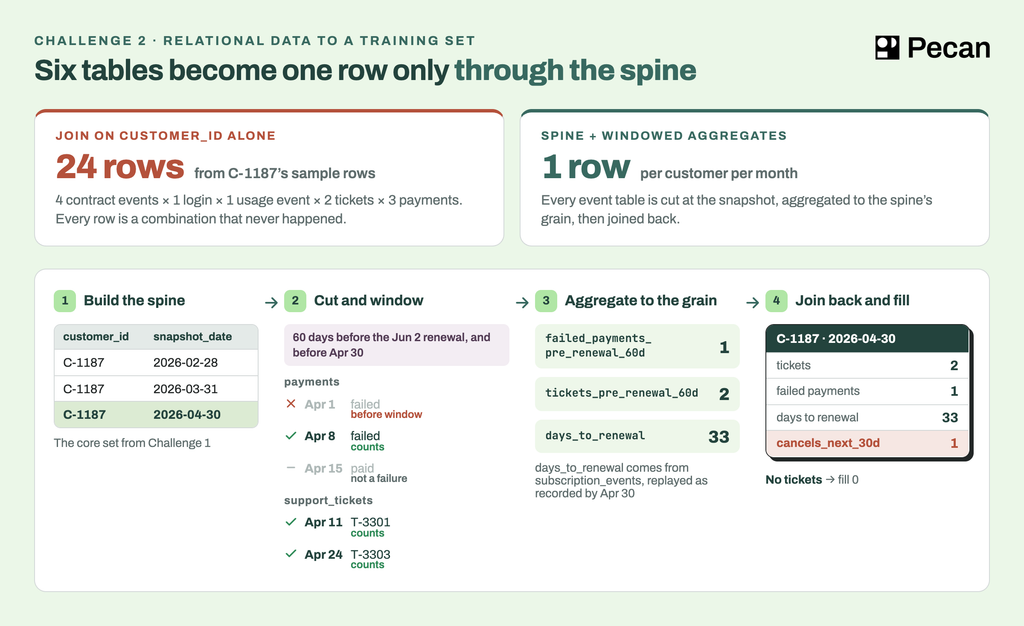
TabPFN’s interface is fit(X, y) and predict(X): one table in, predictions out. Getting from six tables to that one table looks like a join. It isn’t. Join the tables on customer_id alone and every contract event pairs with every login, every ticket and every payment, multiplying into rows that never happened. The six tables don’t share a grain or a clock, and every way of reconciling them involves decisions the data can’t make for you.
The rows don’t exist in any table. The training set’s rows come from the core set built in Challenge 1, the spine: one row per customer per snapshot date. Every other table has to attach to it, so an error in the spine doesn’t stay put. It spreads to every feature joined onto it.
Every join has a time dimension. Each row may only see what was known on its snapshot date. That turns every join into a range join on customer and time. And “known” isn’t always the day something happened: events often reach the warehouse days later, so the timestamp that matters is when the record arrived, not when the event occurred. Miss the cut once and a row sees a cancellation request that hadn’t happened yet. Nothing errors. The model just looks better in validation than it will ever be in production.
Every window is a modeling decision. Logins in the last 30 days, the last 90, or since signup are three different features. Some windows trail the snapshot; others hang off an event, like the 60 days before renewal, which falls on a different date for every customer. Move a window’s edge by a few days and events fall in or out of it, and the feature changes with them.
Everything has to collapse to one grain. Contract events, logins, usage events, tickets and payments each have to be reduced to one row per customer-month (counts, sums, distinct users, days since the last event, ratios) before they can meet the spine without multiplying rows. Every reduction throws information away, and which summary keeps the signal is a judgment call.
The column decides the aggregation. Numeric columns, like payment amounts, can be summed, averaged or taken at their maximum. Categorical columns, like payment status or ticket priority, can’t be averaged, so they become counts or shares per category (failed payments, high-priority tickets) or the most recent value. A satisfaction score can be averaged but not summed. Pick the wrong aggregation and the feature still computes; it just measures nothing.
Missing doesn’t always mean zero. When a customer has no events in a window, the aggregate returns no row, and after the join the value is null. For a ticket count, that null means zero. For an average satisfaction score, a null means there’s nothing to average: no tickets, only open tickets, or surveys nobody answered. Filling it with 0 invents a furious customer. The same null means different things in different columns.
Some tables only know the present. Tables like customers hold today’s values (plan tier, seat count, auto-renew setting, account status), not the values on each snapshot date. Join them as-is and every historical row of a churned customer reads “cancelled”, and every per-seat feature divides by today’s seat count. Rebuilding the history needs a change log that may not exist, and without one the column describes the end of the story. Challenge 4 shows what that does to a model.
It has to run at scale. Event tables like logins and usage_events often hold hundreds of millions or billions of rows. Every range join and aggregation is recomputed for every customer and every snapshot date, then again at each model refresh. Keeping that correct and affordable is an engineering problem of its own.
TabPFN-Rel helps, up to a point. It brings TabPFN to relational data, but configuring tables and relationships in YAML and defining outcomes in SQL still requires technical and business expertise. Its scalability is limited, with large, complex datasets potentially demanding substantial resources and engineering. Column type detection relies on simple rules, while feature generation uses standard aggregations—leaving practitioners to address misclassified columns and supply the business logic those rules miss. Encoding that business knowledge into features is the next challenge.
Challenge 3: Engineering features from domain knowledge
Feature engineering is turning raw records into signals a model can use. A logins table is a list of timestamps; “logins in the last 30 days compared with this customer’s usual 30 days” is a feature. It’s where knowledge of the business enters the model: which behaviors come before a cancellation, over what period, measured against what baseline. A model can only weigh the signals it’s given, so the features set the limit on what it can learn.
Does a foundation model still need it? Prior Labs gives two answers. Its TabPFN-3.5 product page says: “Feed raw data and skip feature engineering.” Its documentation says: “Feature engineering is one of the most impactful ways to improve TabPFN’s performance,” and recommends that you “encode domain knowledge into features that TabPFN cannot learn from raw columns alone.” Both are true. The model reads raw columns; it can’t know what your business treats as a warning sign.

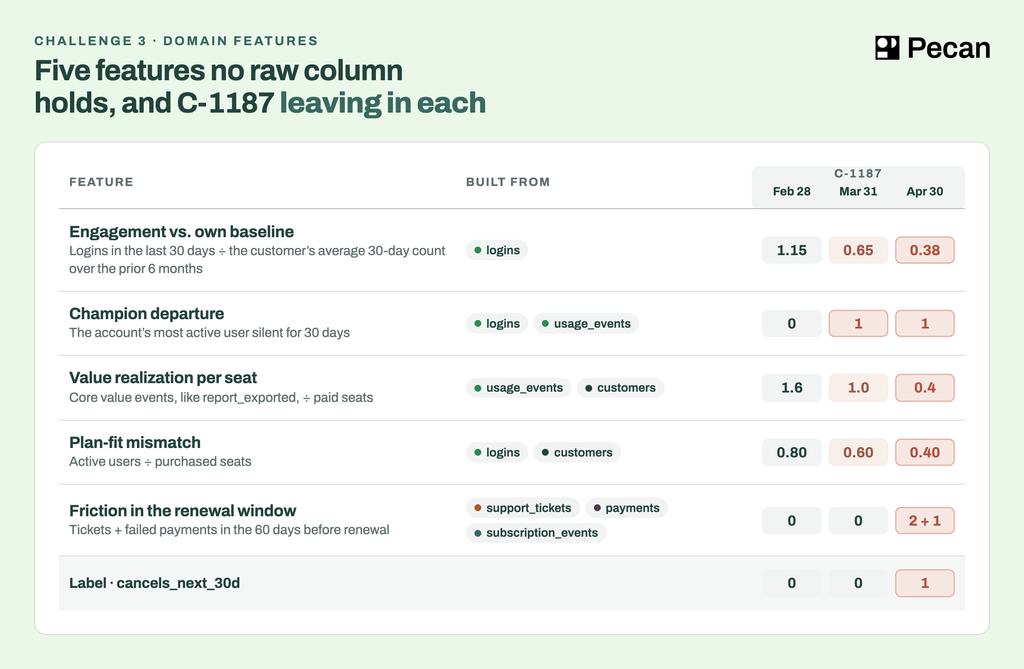
Here are examples of churn features built from domain knowledge, none of which exists as a raw column:
Engagement against the customer’s own baseline. Logins in the last 30 days divided by the customer’s average 30-day count over the prior six months. Two logins is normal for a customer who always logs in twice, and a warning for one who used to log in five times. A raw count can’t tell them apart.
Champion departure. The account’s most active user hasn’t logged in for 30 days. Ask any customer success lead for their most common churn story and this is it. No simple aggregation produces it.
Value realization per seat. Core value events (actions like report_exported that mean the product did its job) divided by paid seats. Five seats exporting forty reports a month are getting value; twenty seats that log in and export nothing are browsing.
Plan-fit mismatch. Active users divided by purchased seats. Well below one means they’re paying for empty chairs, and finance will notice before renewal. Near or above one points to upsell.
Friction in the renewal window. Tickets opened and failed payments in the 60 days before renewal, as of the snapshot.
Even this one feature needs two guards: every event has to fall before the snapshot date, and the renewal date has to be the one known on that date, never computed from the full log. And because the window hangs off renewal, only snapshots with a renewal in the next 60 days have a window at all. C-1042, C-1203 and C-1187’s February and March snapshots get 0, the same value as a customer inside the window with no friction.
Automated feature engineering libraries don’t close this gap. They generate “vanilla” features mechanically: counts, sums, means, min and max over every table and window they’re pointed at. That produces COUNT(logins) and MEAN(csat), but not champion departure, value per seat or friction in the renewal window. Those come from business semantics: knowing which user matters, which events mean the product did its job, and why the weeks before a renewal are different from any others. No library infers that from a schema.
Challenge 4: Catching leakage
A leak is a feature that carries information about the outcome that wouldn’t exist at prediction time. The model learns the answer from the answer: validation looks superb, and production collapses.
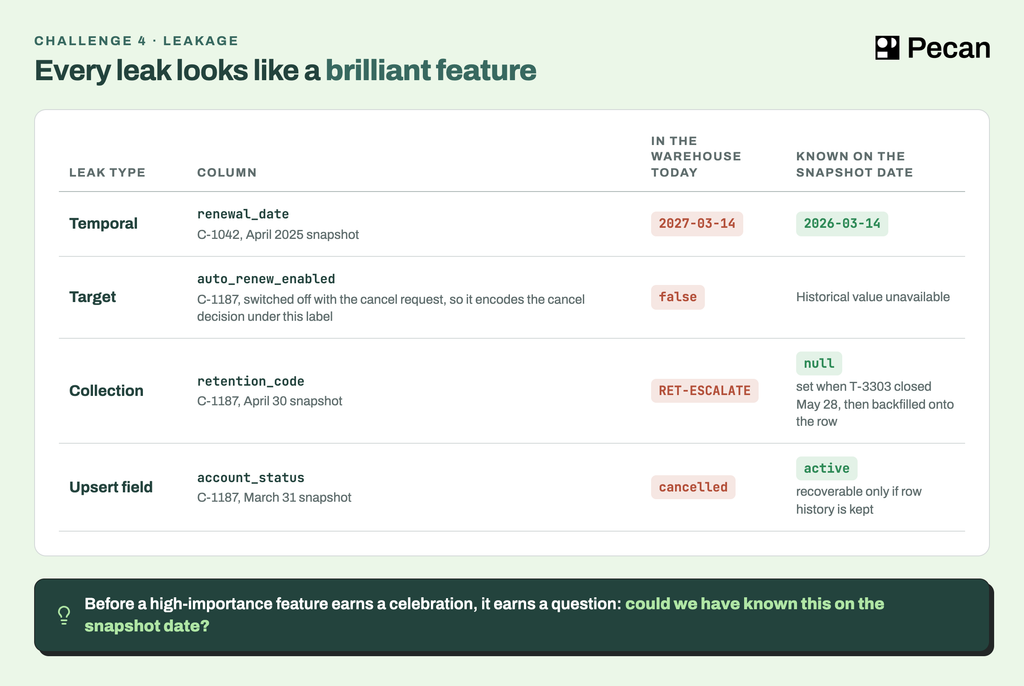
Three columns in the six tables leak under this label. None is a leak by nature: each becomes one because of when it’s written or what it encodes. auto_renew_enabled could be a fair feature if you had its value on each snapshot date, but the customers table holds only today’s value, and customers often switch it off as part of filing the cancellation, so under a request-dated label it encodes the outcome. retention_code is set when the retention team closes a ticket, then backfilled onto the ticket row. T-3303 opened April 24, so C-1187’s April 30 row rightly includes the ticket, but not its code: RET-ESCALATE was written when T-3303 closed on May 28, the day C-1187 asked to cancel again. account_status is overwritten in place, so it reads “cancelled” on every historical row of a churned customer. Each pushes validation accuracy toward perfect and production accuracy toward useless.
Leakage comes in four shapes:
The leakage matrix (what each type is and how it shows up in churn data)
| Leakage type | What it is | Churn example |
|---|---|---|
| Temporal | Features computed with data from after the snapshot date | renewal_date taken from the latest contract, so C-1042’s April 2025 row shows the 2027 renewal instead of the 2026 one known then |
| Target | A feature that is a proxy for, or derived from, the label | auto_renew_enabled, when customers switch it off as part of filing the cancellation |
| Collection | An outcome-related field populated after the snapshot and backfilled onto an earlier record | retention_code, set when the retention team closes a ticket and backfilled onto the ticket row |
| Upsert field | A mutable field overwritten in place, so history carries today’s value | account_status = “cancelled” on every past row of a churned customer |
A foundation model has no way to tell. To TabPFN, a leaked column is just a column that predicts the label unusually well, and it will lean on it as hard as the data allows.
How Pecan handles all four
Pecan’s Predictive AI Agent was built around these four challenges well before foundation models made the modeling step cheap. You ask the question in plain language (“which customers will cancel next month?”), and the agent does the data science.
It frames the question and builds the label. The agent defines the entity, the cadence and the target, then replays the event log into a correct timeline for every customer: withdrawn requests, late-recorded events, renewal dates as they were known at each snapshot, and where each customer’s rows start and stop.
It turns relational data into a valid training set. The agent builds the spine, cuts every event table at the snapshot and chooses the windows. It understands what each column means (an amount, a status, a score, an ID) and applies the aggregations that fit, then collapses everything to one row per customer per month, at the scale of your warehouse.
It engineers features from domain knowledge. Baselines, champion departure, value per seat and renewal-window friction come from patterns in how customers actually leave, not from raw columns.
It screens for leakage before anything is trained. Proxy columns, fields backfilled after the snapshot and values overwritten in place are caught before they can inflate a validation score.
Then the agent trains and validates, and the model that wins on your temporal split ships. The model is a choice the data earns. The four challenges have to be right every time, and that’s the part we’ve spent years automating.
Beyond churn. The same four challenges decide every predictive question, and the traps just change shape. In conversion prediction, fields filled in during the sales process, like opportunity stage, leak the outcome. In upsell and cross-sell prediction, plan_tier is overwritten the moment a customer upgrades. And in customer churn prediction and retention, renewal-date leakage and withdrawn cancellations decide who counts as gone. Pecan applies the same discipline to each one.
Want to see the four challenges handled on a churn problem like yours? Book a demo and we’ll walk you through the platform.
Can you explain TabPFN?
What are tabular foundation models?
Which model is best for tabular data?
Can TabPFN predict customer churn?
Does TabPFN need feature engineering?
What is target leakage?