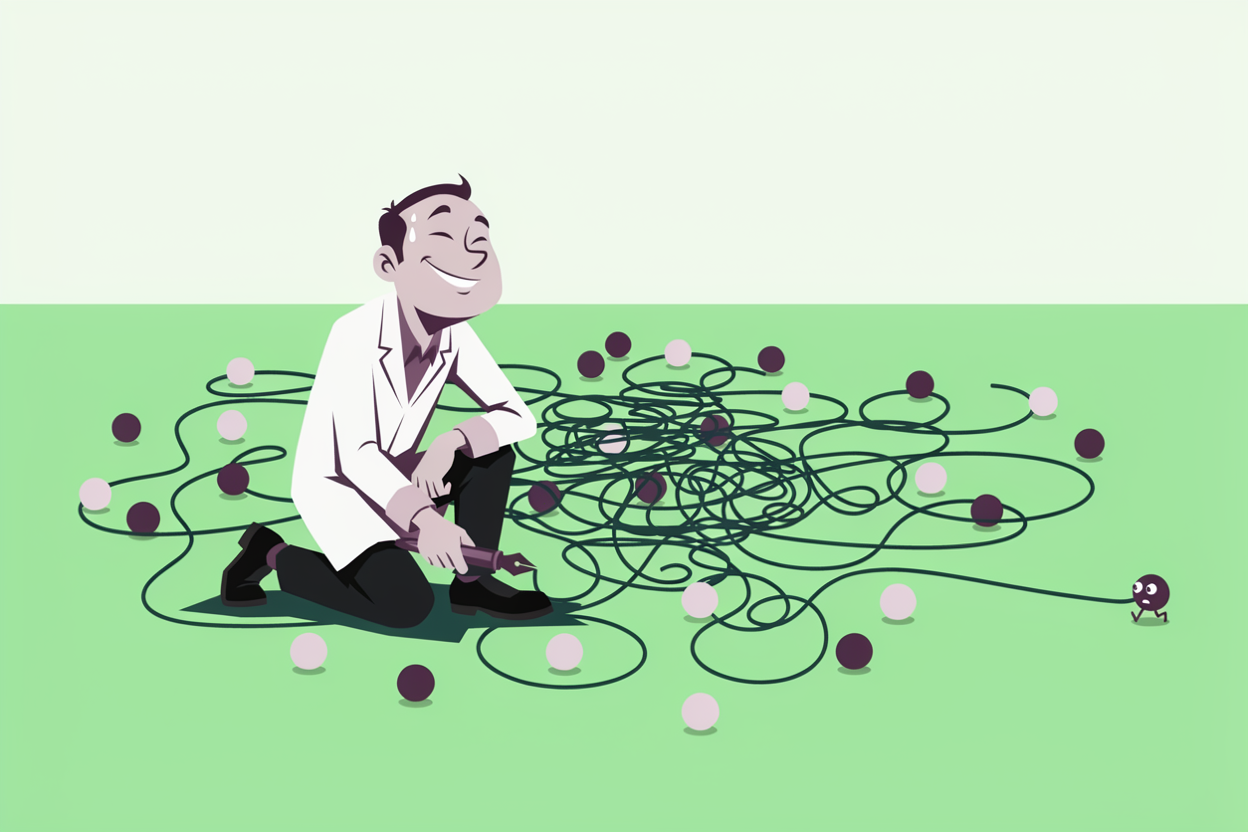
Underfitting means your model is too simple to capture the real patterns in the data, so it performs poorly everywhere, on training data and new data alike. Overfitting means your model memorized noise in the training data, so it looks brilliant in training and falls apart the moment it meets data it hasn’t seen.
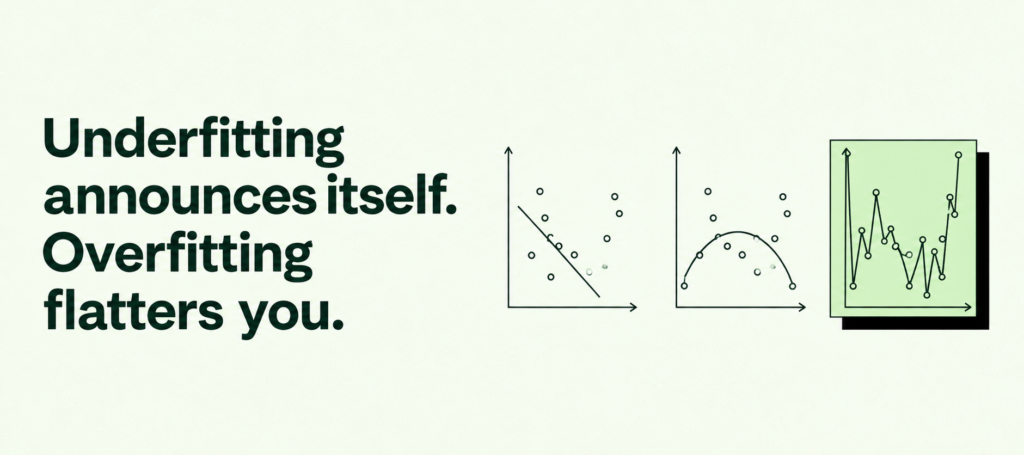
Here’s the part most tutorials get backwards: underfitting is the easy problem. It announces itself immediately with bad numbers, and nobody ships a model with bad numbers. Overfitting is the dangerous one precisely because it flatters you. It hands you a 97% accuracy score, gets applauded in the model review, goes into production, and then quietly makes wrong calls about next month’s customers. In our experience reviewing business models, the overfit model almost always looks like the better model right up until it isn’t.
This guide covers both failure modes across all the types of machine learning, with a comparison table, a concrete detection procedure, fixes for each, and what all of this looks like in a real churn model rather than a textbook dataset.
What is underfitting?
An underfitting model is one that’s too simple for the problem. It hasn’t learned the real relationships in the data, so it produces high error on the training set and high error on validation data. The model isn’t wrong about new data specifically. It’s wrong about everything, consistently.
In statistical terms, underfitting is a high-bias problem: the model makes strong, oversimplified assumptions (say, that churn is a straight-line function of account age) and those assumptions blind it to the actual structure of the data. Machine learning underfitting typically shows up when the model type is too basic for the signal, when training stopped too early, or when the input features simply don’t contain the information needed to predict the target.
The honest diagnosis: if your model performs badly on data it has already seen, more data won’t save it. Something about the model or the features has to change.
What is overfitting?
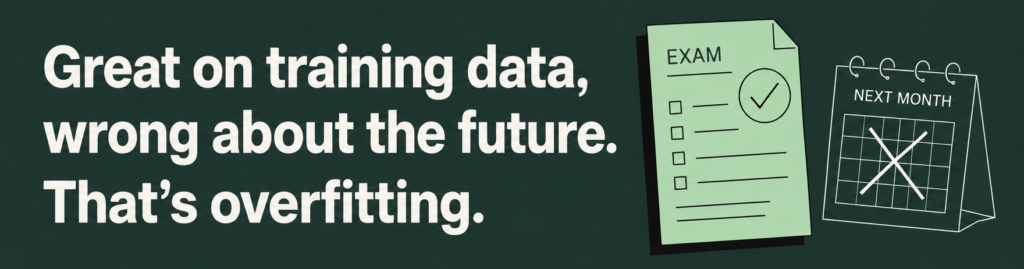
An overfitting model learned the training data too well, including the noise. Instead of extracting general patterns (customers who stop logging in tend to churn), it memorized specifics (customer 48213 churned in March). Model overfitting produces a signature gap: excellent performance on training data, noticeably worse performance on validation data.
This is a high-variance problem. The model is so flexible that it molds itself around random quirks of the particular sample it trained on. Change the sample, and its predictions swing wildly. Overfitting models are common when the model is very complex relative to the amount of training data, when there are too many features and too few examples, or when the training data leaks information about the answer (more on that below, because in business data this is the number one cause).
Overfitting vs. underfitting: the comparison table
| Underfitting | Overfitting | |
| What it is | Model too simple to learn the real pattern | Model memorized training data, including noise |
| Bias / variance | High bias | High variance |
| Training error | High | Very low |
| Validation error | High (close to training error) | Much higher than training error |
| Common causes | Model too basic, weak features, training stopped early | Model too complex, too little data, data leakage, too many features |
| How it feels | Disappointing from day one | Impressive in training, disappointing in production |
| Fixes | Richer features, more complex model, train longer | More data, regularization, simpler model, fix leakage, early stopping |
The underfit vs overfit distinction comes down to one comparison: where the errors sit. Both errors high and close together points to underfitting. Training error low but validation error high points to overfitting. That single gap is your diagnostic instrument, which brings us to detection.
How to detect overfitting and underfitting (train vs. validation error)
You can’t tell whether a model is overfitting or underfitting from a single accuracy number. You need two numbers and the gap between them. Here’s the procedure we’d recommend to any analyst, whether or not they ever touch our platform:
- Split your data before training. Hold out a validation set the model never sees. For business data with a time dimension (which is nearly all of it), split by time: train on January through September, validate on October onward. Random splits let the model peek at the future.
- Compare training error to validation error. Compute the same metric on both sets. A model with 96% training accuracy and 95% validation accuracy generalizes well. A model with 96% and 78% is overfit. A model with 71% and 70% is underfit, assuming 71% is genuinely poor for your problem.
- Read the learning curve. Plot both errors as training progresses. Underfitting: both curves plateau early at a high error, close together. Good fit: both descend and converge. Overfitting: training error keeps dropping while validation error flattens and then climbs. The moment validation error starts rising is the moment the model stopped learning patterns and started memorizing.
- Worry at the right thresholds. There’s no universal cutoff, but useful rules of thumb: a validation error more than 10 to 15% worse (relative) than training error deserves investigation, and any model that predicts a rare event with suspiciously near-perfect scores deserves interrogation before celebration.
- Hunt for leakage before you blame complexity. In business datasets, the most common cause of an overfit-looking model is data leakage: a feature that secretly encodes the answer, like a “cancellation reason” field in a churn model or a total computed after the outcome occurred. Leakage produces the same signature as overfitting (stellar training, poor production) and no amount of regularization fixes it.

How to fix underfitting
Underfitting means the model needs more capacity or better raw material. In rough order of payoff for business problems:
Give the model better features, not just more rows. Underfitting in business data is usually a feature problem before it’s an algorithm problem. Raw columns like signup date and plan tier rarely predict much on their own; behavioral aggregations (purchases in the last 30 days, days since last login, trend in weekly usage) carry the actual signal. This is exactly the work that feature engineering does, and it’s usually worth more than switching algorithms.
Use a more expressive model. If a linear model can’t capture the pattern, move to something that handles non-linear relationships and interactions, like gradient-boosted trees, which have become the workhorse for tabular business data for good reason.
Train longer, regularize less. If you’ve applied heavy regularization or stopped training very early, you may have induced underfitting yourself. Ease off and watch the validation curve.
Question whether the signal exists. Sometimes a model underfits because the target genuinely can’t be predicted from the available data. That’s not a modeling failure; it’s a data collection finding, and discovering it early is a win.
How to fix overfitting
Overfitting means the model needs constraint, more evidence, or cleaner inputs:
Get more training data. The cheapest cure when it’s available. Noise doesn’t replicate across a larger sample; real patterns do.
Regularize. Techniques like L1/L2 penalties, limiting tree depth, and dropout all penalize complexity and force the model to keep only patterns that earn their place.
Use early stopping. Stop training at the point where validation error bottoms out, before the memorization phase begins.
Simplify the feature set. Hundreds of features with a few thousand rows is an invitation to memorize. Cut features that don’t contribute, especially IDs and near-unique fields.
Fix the leakage. Worth repeating because it masquerades as overfitting and survives every other fix: audit any feature that would not have been available at prediction time. If your churn model knows the contents of a churn survey, it isn’t predicting anything.
Validate out of time. Retrain and validate on a time-based split. Models that only look good on random splits are often exploiting temporal leakage.
Evaluating whether your model generalizes
Spotting the underfit/overfit signature is step one. Deciding whether a model is actually good enough to act on requires a slightly wider evaluation toolkit, and it’s worth getting these four ideas straight before you build and train a model you intend to deploy.
Accuracy, and why it lies. Accuracy is the share of correct predictions, and it’s dangerously misleading on imbalanced problems. If 3% of customers churn monthly, a model that predicts “nobody churns” scores 97% accuracy and helps no one. Always check accuracy against the base rate.
Precision and recall. Precision asks: of everyone the model flagged, how many were right? Recall asks: of everyone who actually churned, how many did the model catch? They trade off against each other, and the right balance is a business decision. A retention team with limited budget wants precision (don’t waste offers); a fraud team wants recall (don’t miss cases).
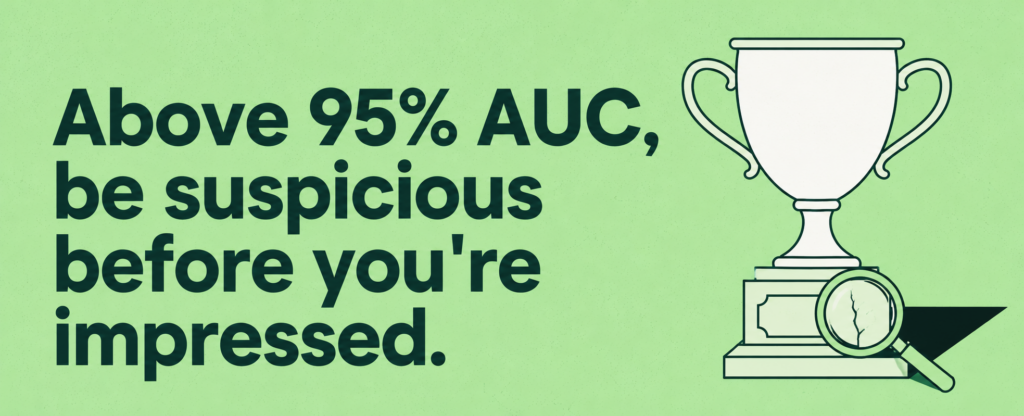
AUC. The area under the ROC curve measures how well the model ranks positives above negatives across all thresholds. It runs from 0.5 (coin flip) to 1.0 (perfect). For most business problems, 0.75 to 0.9 is a strong, believable range. Above roughly 0.95, be suspicious before you’re impressed; in our experience that’s leakage territory more often than genius territory.
Lift. The most business-legible metric of the lot. If the top decile of your model’s churn scores contains 4x as many actual churners as a random sample, that’s a lift of 4, and it translates directly into campaign math: same budget, four times the at-risk customers reached.
All of these are only meaningful on a holdout set. Evaluating on training data is grading a student on questions they’ve already seen with the answer key open. Holdout validation is non-negotiable, and out-of-time holdout is the gold standard for business data, because your model’s real job is always predicting a future period it has never seen.
Since these checks are exactly where hand-built projects tend to cut corners under deadline pressure, our platform runs them automatically on every model: time-based holdout splits, leakage detection that flags suspicious features before training, and out-of-time validation as the default evaluation. And a directional observation from onboarding: a meaningful share of the first-draft models customers bring to us, or first attempts built in the platform before the guardrails weigh in, show leakage or overfit warning signs that get caught and corrected before deployment. These failure modes are the norm for first drafts, not the exception, which is exactly why the checks shouldn’t be optional.
What this looks like in a business model, not a textbook
Picture a churn model for a subscription business. An analyst pulls a training table: customer ID, plan, tenure, support tickets, usage stats, and a churned yes/no label. The model trains, hits 98% accuracy, and everyone’s thrilled.
Then it goes live, scoring next month’s customers, and its predictions are barely better than guessing. What happened?
Two textbook failures wearing business clothes. First, customer ID slipped in as a feature, and a sufficiently flexible model happily memorized which IDs churned. IDs are the purest overfitting fuel there is: perfectly predictive in training, perfectly useless for anyone new. Second, the model trained and validated on the same historical window, so it never had to prove it could handle a period it hadn’t seen. Customer behavior drifted (a price change, a new competitor, seasonality), and the memorized past stopped resembling the arriving future.
The fix maps exactly to everything above: drop the ID, validate out of time, check the train-versus-validation gap before celebrating. When PlaySimple, a mobile game maker ranked among the top word-game publishers worldwide, built predictive LTV models with Pecan, the entire point was generalization to the future: models that predict a player’s Day 30 lifetime value from Day 2 data reached 95% accuracy, measured on how well predictions held up against what actually happened, not on how well the model recited its training set. That’s the standard your models should be held to, because that’s the only standard the business ever experiences.
If you’d rather have the generalization checks handled for you (time-based splits, leakage detection, out-of-time validation, all applied to every model by default), book a demo and we’ll walk you through how the platform does it.
What is the main difference between overfitting and underfitting?
How can you tell if a model is overfitting or underfitting?
Is bias overfitting or underfitting?
Is 99% accuracy overfitting?
Can you give an example of overfitting?

Omer is a Data Scientist at Pecan AI with an M.Sc. in Industrial Engineering, bringing a strong analytical foundation built across multiple industries. He combines structured problem-solving with cross-disciplinary collaboration to drive meaningful impact through data.