Every data analyst eventually hits the same wall. Stakeholders want predictions, not just reports about what already happened. They want to know which customers will churn next quarter, how much inventory to order for back-to-school, which leads the sales team should call first. And they want it yesterday.
The good news? The toolkit has matured. Predictive analytics techniques today are more accessible than ever, and you can build predictive analytics models that hold up in production without spending six months on infrastructure. The trick? Knowing which technique fits which problem, which algorithm to pair it with, and how to spot a tool that handles the unglamorous parts for you.
This guide covers the main predictive data analysis techniques, the algorithms behind them, what to look for in predictive analytics tools, and where each approach pays off in real business situations.
Key highlights:
- The main predictive data analysis techniques include classification, regression, clustering, time-series forecasting, and anomaly detection. Each one answers a specific type of business question.
- The best predictive analytics tools handle the boring parts (data prep, feature engineering, validation, deployment) automatically, so you can focus on the questions and the actions instead of fighting your data.
- Pecan AI builds and validates predictive machine learning models from your raw business data, with no coding required, and delivers predictions directly into the systems your team already uses every day.
What are predictive analytics techniques?
Predictive analytics techniques are the categories of methods analysts use to forecast future outcomes from historical data. Think of them as different types of questions you might ask. Classification asks which group something belongs to (will this customer churn?). Regression asks for a number (how much will this customer spend?). Clustering asks how things group together. Time-series forecasting asks what happens next in a sequence. Anomaly detection asks what looks weird.

A technique isn’t the same as an algorithm. That distinction trips people up constantly, so we’ll come back to it. For now, just know this: the technique is the kind of question you’re answering. The algorithm is the math doing the answering. You can solve the same problem with multiple algorithms, and picking the right combination is most of the job.
This is also where predictive analytics for business growth starts paying off. Once your team has a clear handle on which technique fits which question, you can move from describing the past to acting on what’s coming next.
Predictive data analysis techniques every data analyst should master
Most predictive analytics methods fall into two camps depending on the data you have. Supervised learning works when your historical data already includes the outcome you’re trying to predict, like customers labeled as churned or retained, transactions labeled as fraud or legitimate. The model learns from those labels. Unsupervised learning works when there’s no answer key. You’re asking the model to find patterns on its own.
The choice between them isn’t really a choice. It’s dictated by what’s in your dataset. Knowing which camp you’re operating in saves a lot of time and a lot of false starts.
| Learning approach | Key characteristics | Common predictive analytics algorithms | Typical use cases in businesses |
| Labeled data (supervised) | The model trains on historical data that already includes the outcome you want to predict. Performance is measured against known answers. | Linear regression, logistic regression, decision trees, random forest, gradient boosting, SVM, KNN, Naïve Bayes, neural networks, ARIMA | Churn prediction, lead scoring, demand forecasting, customer LTV, fraud detection, late delivery risk |
| Unlabeled data (unsupervised) | The model looks for structure or unusual patterns without being told the right answer ahead of time. Best when you don’t have outcome labels but want to discover groupings or outliers. | K-means clustering, isolation forest, DBSCAN | Customer segmentation, anomaly detection, behavioral grouping, fraud discovery |
Now let’s break down the five main techniques themselves. These are the types of predictive modeling you’ll use most often.
Regression analysis
Regression analysis predicts a continuous numeric value. How many dollars will this customer spend in the next 12 months? How many units of this product will sell next week? What will revenue look like for Q3? If the answer is a number on a scale, regression is your starting point. It’s one of the oldest predictive modeling methods and still one of the most useful, especially when paired with feature engineering that captures meaningful business drivers.
Classification methods
Classification methods predict which category something belongs to. Will this customer churn or stay? Is this transaction fraud? Will this lead convert? Classification handles binary questions (yes/no) and multi-class questions (which of these five segments). It’s the workhorse technique behind a huge share of predictive analytics use cases, from lead scoring to fraud detection to medical diagnosis.
Clustering techniques
Clustering techniques group similar items together without you specifying what “similar” means. The model figures it out from the data. This is the main approach for customer segmentation when you don’t know the segments yet, and you want them to emerge from actual behavior rather than from a marketer’s intuition. Clustering is unsupervised, so there’s no “right answer” to validate against, which means interpreting results takes a bit more judgment.
Time-series forecasting
Time-series forecasting predicts how a value will change over time. Future demand, future revenue, future website traffic. The technique respects sequence and seasonality, which standard regression often doesn’t handle well. If your data has a date column and the order of events matters, you probably want time-series forecasting in your toolkit.
Outlier or anomaly detection
Outlier detection finds the data points that don’t fit. Unusual transactions that might be fraud. Equipment readings that suggest a failure is coming. Operational events that signal something’s gone sideways. Some anomaly detection is supervised (you have past labeled examples), but a lot of it is unsupervised, since you often don’t know in advance what “abnormal” looks like.
Predictive analytics algorithms that will power your models
Techniques and algorithms aren’t the same thing, and most articles on this topic blur the line. A technique is the type of question. An algorithm is the specific recipe for answering it. Random forest, for example, isn’t a technique. It’s one algorithm you can use to do classification (or regression). Logistic regression is another. Both serve the same technique, with different strengths and tradeoffs.
Below are the predictive analytics algorithms you’ll see most often in production. You don’t need to memorize the math. You do need to know which is which, and when each is the right tool for the job.
Linear regression
Linear regression fits a straight line through your data to predict a numeric outcome. Simple, fast, easy to explain to a stakeholder. Works well when the relationship between your inputs and outputs is roughly linear. Falls apart when the real-world relationship is more complicated, which it usually is.
Logistic regression
Logistic regression predicts the probability of a yes/no outcome. It’s the classification cousin of linear regression. A great default when you want a simple, transparent model that’s easy to interpret. If a stakeholder asks “why did the model say this?”, logistic regression gives you a clean answer.
Decision tree
A decision tree splits your data with a series of yes/no questions, like a flowchart. Easy to visualize. Easy to explain. The downside is that a single tree can overfit your training data and perform badly on new data. They’re rarely used alone in production for that reason, but they’re the building block for much stronger algorithms.
Random forest
Random forest takes many decision trees and averages their predictions. The combination is more reliable than any individual tree. It handles messy data well, deals with both classification and regression, and tends to perform respectably out of the box without much tuning. A solid default for many predictive modeling tools.
Gradient boosting
Gradient boosting also combines many trees, but instead of averaging them, it builds them in sequence so each new tree corrects the mistakes of the previous ones. Algorithms like XGBoost, LightGBM, and CatBoost dominate Kaggle competitions for a reason. They’re often the most accurate option for tabular business data, which is exactly the kind of data most companies have sitting in their warehouse.
Support vector machine (SVM)
SVMs draw the best possible boundary between classes in your data. They handle high-dimensional spaces well and can be very accurate, though they’re slower to train on large datasets and harder to interpret than tree-based methods. Less common in modern business analytics workflows, but still useful in specific cases.
K-nearest neighbors (KNN)
KNN classifies a new data point by looking at the K most similar points in your training data and taking a vote. Simple to understand, no actual “training” required (the algorithm just memorizes your data). The catch is that prediction is slow at scale, since the model has to compare each new point against everything it’s seen before.
Neural networks and deep learning
Neural networks are layered models loosely inspired by how the brain processes information. They can capture extremely complex patterns and are the technology behind most of what people now think of as “AI.” For predictive machine learning models on standard tabular business data, neural networks are often overkill. They shine on images, text, audio, and very large datasets where simpler algorithms hit a ceiling.
Naïve Bayes
Naïve Bayes uses probability theory to classify data points. The “naïve” part comes from an assumption that all features are independent of each other, which is rarely true in real data. Despite that, the algorithm performs surprisingly well on certain problems, especially text classification. Fast and lightweight when you need a quick baseline.
ARIMA
ARIMA (AutoRegressive Integrated Moving Average) is a classic algorithm for time-series forecasting. It models how past values and past errors predict future values. It’s been around for decades and still earns its keep, particularly for stable, predictable series. For series with strong seasonality, irregular patterns, or business drivers like promotions and pricing, modern alternatives often outperform it.
K-means clustering
K-means is the most common clustering algorithm. You tell it how many groups (K) you want to find, and it organizes your data into that many clusters by minimizing the distance between points within each group. The output is fast and intuitive. Picking the right K is the art.
Isolation forest
Isolation forest is built specifically for anomaly detection. It works by isolating outliers, which are easier to “isolate” in a tree structure than normal points. The intuition: weird points get separated from the rest of the data quickly, so they end up shallow in the tree. Common in fraud detection and operational monitoring.
What to look for in predictive analytics tools: techniques, methods, and more

Picking the right tool matters more than picking the right algorithm. The best predictive modeling tools take care of the boring parts so your team can focus on the questions and the actions. The criteria below fall into three buckets: model quality (is the model rigorous?), business usability (can your team actually use it?), and deployment and monitoring (does it work in production over time?). Run through all three before you commit:
Model quality
This is the rigor of the model itself. Without it, everything else is decoration on top of bad predictions.
- Relevant technique: Your model should use the right predictive analytics techniques for the job, such as classification, regression, or forecasting. Make sure the tool you’re using offers what you need, since the wrong technique can lead to weak predictions.
- Validation method: A good tool validates models the way a data scientist would. That means out-of-time testing (training on older data, testing on newer), proper cross-validation, and honest performance reporting. If a tool only shows you accuracy on the training set, walk away.
- Leakage prevention: Data leakage is when information from the future sneaks into your training data, making your model look brilliant in testing and useless in production. Good tools catch this automatically by enforcing time boundaries and flagging features that wouldn’t actually be available at the moment of prediction.
- Overfitting control: A model that memorizes your training data won’t generalize to new cases. Your tool should regularize, prune, or otherwise prevent the model from getting too clever for its own good. Without that, you’ll see strong test results and disappointing reality.
- Useful metrics: Accuracy alone is rarely the right number to optimize. For an imbalanced churn problem, precision, recall, AUC, and lift matter more. For a forecasting problem, MAPE, RMSE, and bias direction tell you different things. Look for tools that surface metrics tied to business value, not just the prettiest one.
Business usability
A technically perfect model that nobody can run, interpret, or trust is just an expensive paperweight. Usability is what turns a model into a decision.
- Strong data prep: A good modeling tool should handle messy, incomplete, or disconnected data well, automatically. If you’re still doing CSV gymnastics in Excel, the tool isn’t earning its place.
- Feature engineering: Raw data is not enough to generate useful predictive signals, so ensure your modeling tool handles feature engineering to help your model find real patterns.
- Explainability: When a stakeholder asks “why did the model predict this?”, you need an answer. SHAP values, feature importance scores, and case-level explanations help you defend predictions and spot when the model is picking up on something nonsensical. Without explainability, you’re shipping a black box, and stakeholders won’t trust it.
Deployment and monitoring
A model that never gets used is worthless. This bucket is about whether predictions actually reach the people making decisions, and whether they keep working over time.
- Deployment readiness: A model that lives in a notebook isn’t really a model. It’s a science fair project. Your tool should push predictions directly into the systems your team uses (CRM, marketing automation, data warehouse, BI dashboard) without requiring a separate engineering project to make it work.
- Monitoring and retraining: Models decay. Customer behavior shifts, markets move, and a model trained last year might quietly stop working. Good tools watch performance over time, alert you when things drift, and help you retrain on fresh data without starting from scratch.

For teams ready to push further, advanced predictive analytics capabilities like automated feature engineering, agentic workflows, and built-in guardrails turn predictive modeling from a multi-month project into something you can actually ship.
Predictive analytics applications (and techniques to use for each)
The theory is fine. What matters is what you do with it. Below is a quick reference linking common predictive analytics applications to the techniques that fit each one. If you’re sketching out a project plan, this is a useful starting map for figuring out how predictive analytics is used in business across functions.
| Predictive analytics use cases | Techniques you should use | Why these techniques fit |
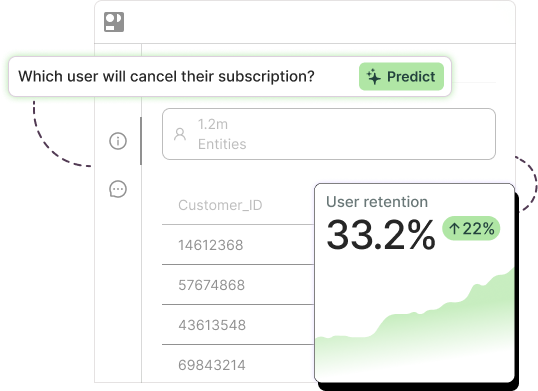
| Churn prediction | Classification methods | Classification methods help you predict whether a customer will stay or leave |
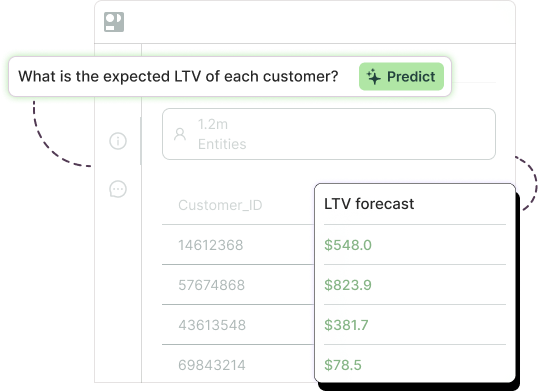
| Customer lifetime value (LTV) prediction | Regression analysis | Regression analysis can predict a future numeric value, such as projected customer revenue |
| Demand forecasting | Time-series forecasting, regression analysis | Time-series forecasting can model trends and seasonality. Regression analysis can include drivers such as promotions, pricing, or holidays in your forecasts |
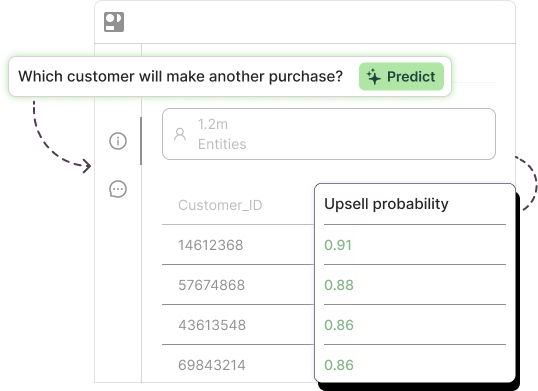
| Lead scoring | Classification methods | Classification methods will give you a probability of whether a lead will convert or not |
| Fraud detection | Classification methods, outlier or anomaly detection | Classification methods catch known fraud patterns. Outlier or anomaly detection helps you spot unusual behavior that falls outside normal activity |
| Customer segmentation | Clustering techniques | Clustering techniques can group customers with similar behaviors or characteristics |
| Marketing campaign optimization | Regression analysis, classification methods | Regression analysis can predict outcomes such as revenue or campaign ROAS. Classification methods help you identify who will click, convert, or respond |
| Inventory planning | Time-series forecasting, regression analysis | Time-series forecasting can predict future demand. Regression analysis accounts for business factors that influence inventory needs |
| Late delivery risk | Classification methods | Classification methods help you predict whether a shipment will arrive on time or miss an SLA |
| Shipment duration prediction | Regression analysis | Regression analysis can predict a continuous value, such as delivery time in days |
| Product recommendation or next-best offer | Classification methods, clustering techniques | Classification methods can help you score who’s more likely to respond to an offer. Clustering techniques can match offers to similar customer groups |
| Operational issue detection | Outlier or anomaly detection | Outlier or anomaly detection will help you find unusual events, failures, or process issues in your forecasts before they spread |
Experience the best predictive analytics tools and techniques with Pecan
Knowing the right predictive analytics methodology is one thing. Building, validating, and deploying models that actually move metrics is another. That’s where most teams get stuck, not because the techniques are too hard, but because the work around the techniques (data prep, feature engineering, validation, deployment, monitoring) eats every hour of available time.

Pecan’s predictive AI agent does that work for you. You ask a business question in plain English. The agent figures out the right predictive analytics techniques, prepares your data, builds and validates the model, and pushes predictions directly into the tools your team already uses, like Salesforce, HubSpot, and your data warehouse. No code. No waiting weeks for a data team. No black box, either, since every prediction comes with an explanation and a confidence score.
Across customer deployments, Pecan has delivered roughly 12% average churn reduction for retention teams, 15% average ROAS improvement for marketers using predictive campaign ROAS models, 60% average reduction in planner time spent building demand forecasts, and faster pipeline conversion for sales teams using predictive lead scoring. Predictive models reach production in about a week, up to 32 times faster than traditional data science approaches.
If you’ve got business questions worth answering, we’d love to show you what the agent can do with your data.
What are the most commonly used predictive modeling techniques?
Which type of data is commonly used in predictive analytics?
What are modeling techniques in predictive analytics?

Asaf is the Head of Customer Success at Pecan AI, where he helps enterprise customers turn predictive analytics into real, measurable business outcomes. He’s grown through Pecan from AI Success Manager to Team Lead to Director, bringing a strategic consulting background and an Economics degree from the Hebrew University of Jerusalem (plus a serious scuba diving habit).