In a nutshell:
- Deploying a model without testing its performance first is not recommended.
- Pecan's dashboard allows for a reliable evaluation of your model's predictions against actual outcomes.
- The dashboard splits your data for training and testing, providing a controlled environment to assess predictive accuracy.
- The Model Output sub-tab offers insight into the model's predictions.
- Take the time to assess your model's performance before deploying it to ensure success.
It's the top question I get from Pecan users: "I built a model. But how can I deploy it to test how good it is?"
It might seem like the best way to test your model is to deploy it—to actually put it into production and let it run wild. Be free, model, and let's see how you do!
While tempting, that's not the best approach. You want to be sure you're fully happy with your model's performance before you deploy it (and deployment is a whole other topic for another post).
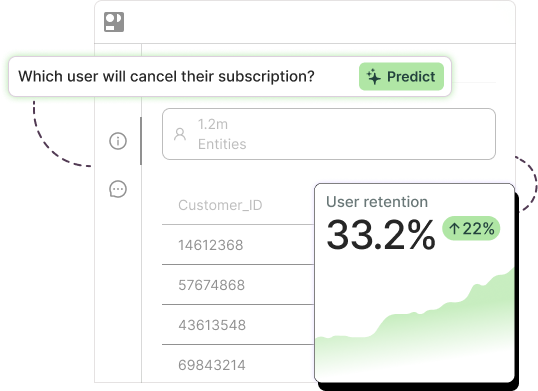
Why? It's not the most insightful or safest method. One reason is that you don't have any basis for comparison for your new model. For example, let's say the model tells you that someone will churn in the next month:
- You'll have to wait a month until you know if the prediction was correct or not.
- Now that you know they're predicted to churn, any unique actions you take to prevent that might affect the result and bias your model evaluation.
Fortunately, we've built helpful tools right into Pecan for evaluating your model's performance before you deploy.
Meet the dashboard
Pecan's dashboard offers a more reliable and comprehensive evaluation by comparing your model's predictions against actual outcomes from your data. Testing the model is actually built into our automated processes.
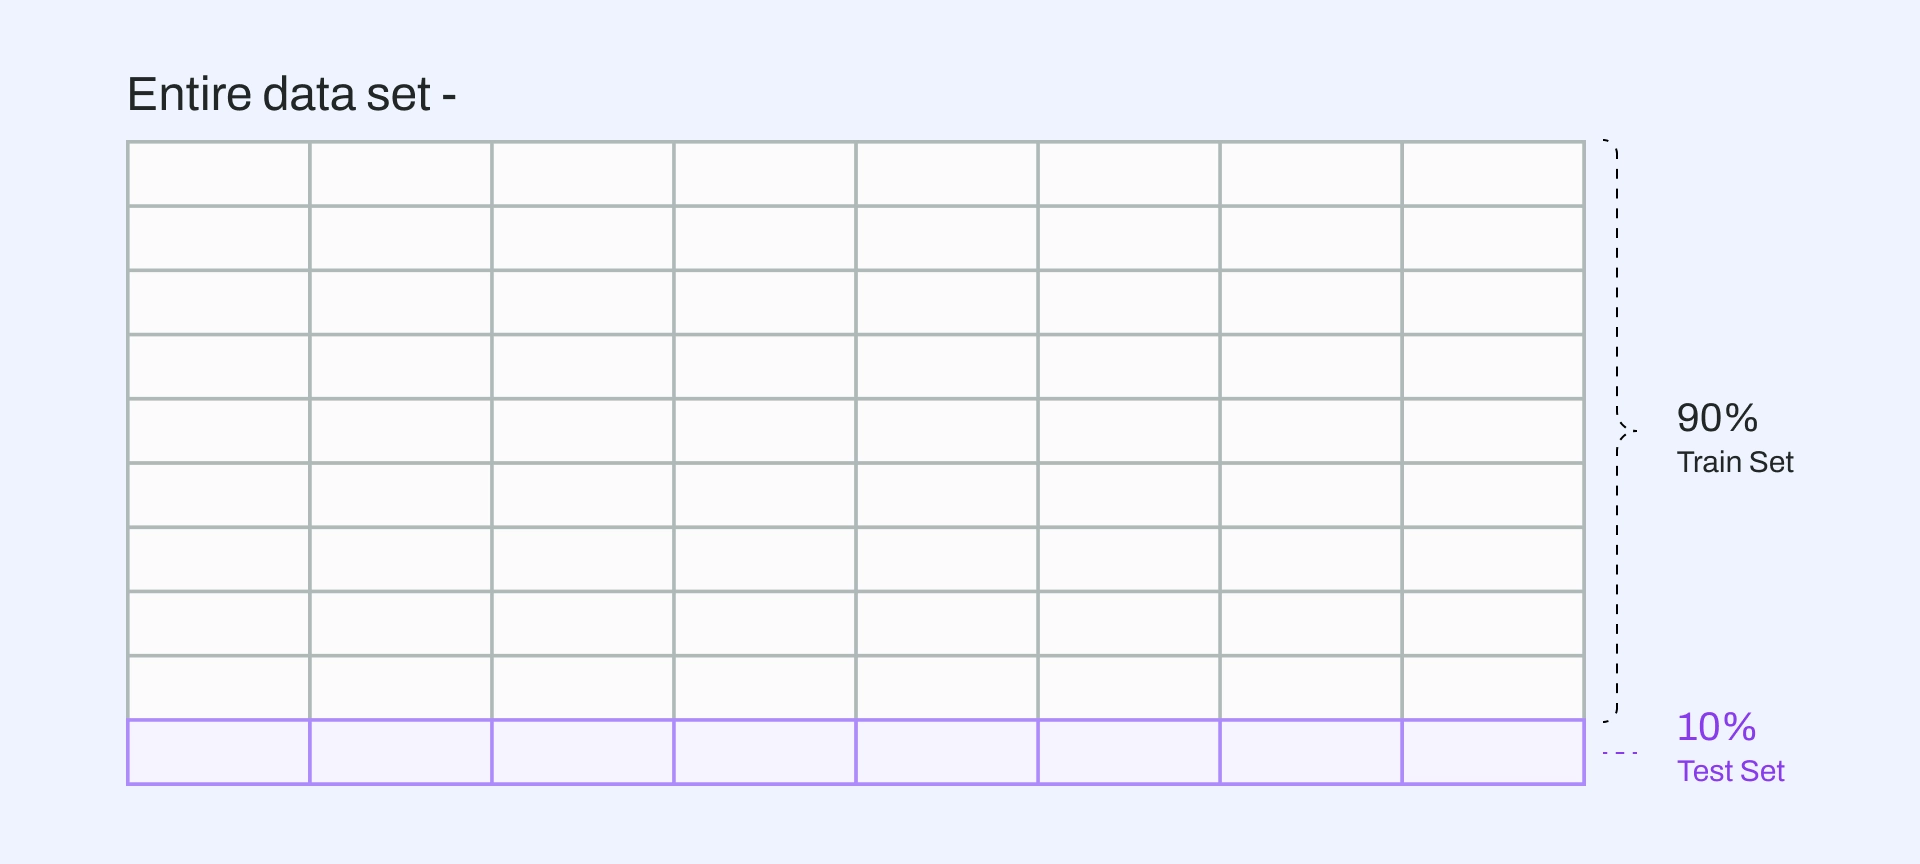
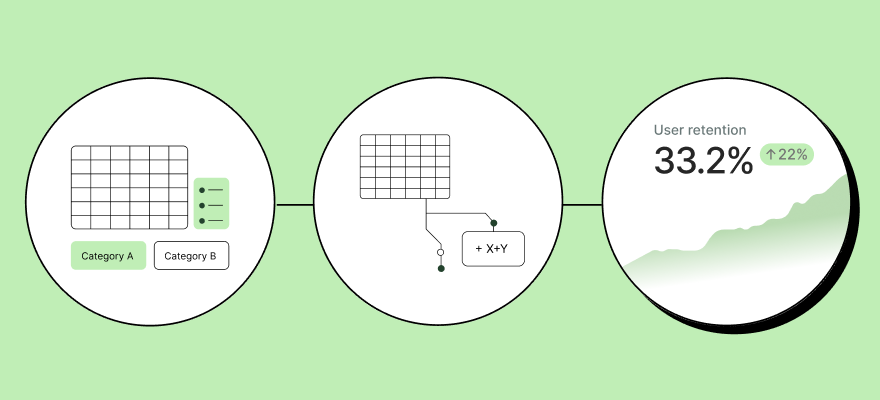
Dividing data for training and test sets
Once you send a model to train, Pecan takes your entire data set and splits it. 90% of the data is used to train the model (i.e., the training set), and the remaining 10% is used to test the model.
This test set consists of the most recent 10% of your data, mirroring as closely as possible the current, real-world conditions your model will face.
This testing approach allows you to understand the model's predictive accuracy in a controlled environment before going live.
What does that look like in Pecan? In the dashboard, you can compare each prediction to what actually happened, and check on model health.
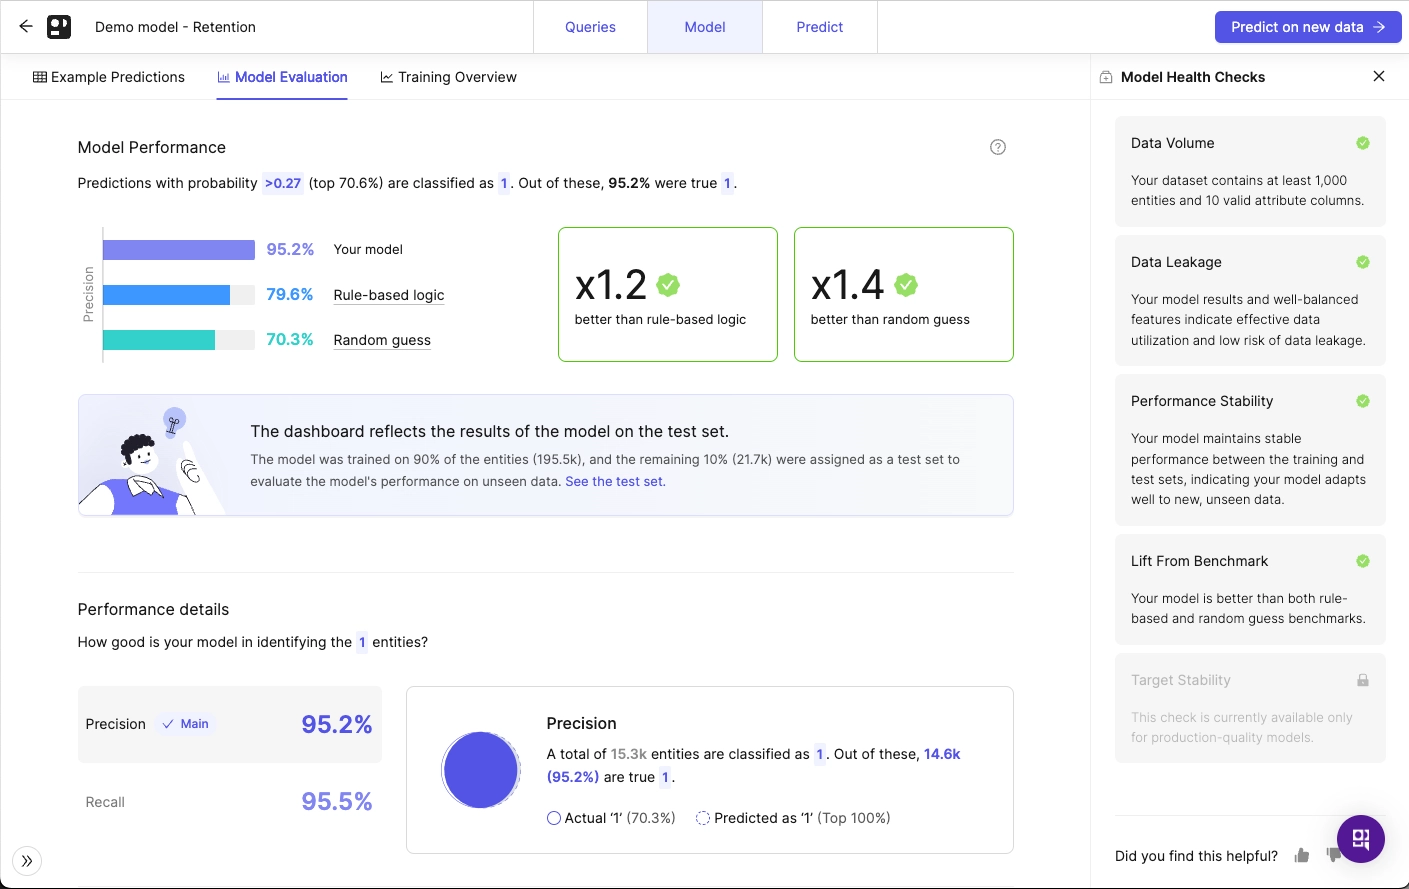
A Pecan model evaluation dashboard
If you're curious about the nitty-gritty of the model's predictions, the Model Output sub-tab on our dashboard serves as a window into the model's brain.
You can see the predictions laid out there. But remember, in a live environment, the 'Actual' column wouldn't be present yet — after all, predictions are about the future, and we're yet to discover what it holds.
Be ready for ML success
This process ensures you're fully informed about how your model performs under near-real conditions, setting you up for success when you're ready to deploy.
Want to dive deeper? Learn more about the dashboard details for binary models and regression models.
So while you might be tempted to rush your model out the door and into the world, take some time with these helpful dashboards to get to know your model and ensure it's performing well. It's an important step on your AI journey, so we want to be sure you have all the info you need at your fingertips, right inside Pecan!
Dive into building and refining your own AI model now with a free trial of Pecan.

Ori is a Customer Engagement Manager at Pecan AI, where he’s helped customers adopt predictive analytics from first demo to real business impact. He’s grown through Pecan support and customer success, wearing hats across CSM, solutions engineering, and customer onboarding, and turning complex ML concepts into simple, actionable workflows.