
This article is part of our Predictive Frameworks series, which explores the most effective use cases for predictive analytics.
In an earlier post, we discussed why a predictive approach to customer lifetime value (LTV) is critical for businesses today and how it differs from (and dramatically improves upon) historical analysis of LTV.
This second post explores examples of using predicted LTV in your business. We also go into more detail on how predicting LTV works in practice.
Putting LTV Predictions to Work in Your Business
With LTV predictions in hand, you can shape your marketing campaigns, messaging, and optimization to obtain and nurture high-value customers. After all, they’ll benefit your business most in the long run.
For example, you can use LTV predictions to answer questions like these and many more:
- Which potential customers should we include in remarketing campaigns based on predicted LTV?
- Which customers should we make a special effort to “surprise and delight” to reinforce their loyalty?
- What is the relationship between our customer acquisition cost (CAC) and predicted LTV? What does it say about the efficiency of our marketing spend during a specific time period? Or, in the mobile and gaming world’s terms, how does our CPI relate to our pLTV?
- Which customers should receive upgraded customer service or other perks? For example, in online retail, should high-value customers get special free shipping offers?
- Which customers might be most interested in upsell or cross-sell offers?
- Who in our customer base should we invite to exclusive in-person or virtual events and activities?
- How can we target campaigns to audiences who are “lookalikes” for our current high-value customers?
- …and more questions specific to your industry and business!
Again, you can answer these questions in advance using LTV predictions. That’s possible before or within the first few days of the start of your relationship with individual customers.
You’re not waiting for days, weeks, or months to see who becomes a high-value customer, wasting a lot of money on ultimately ineffective campaigns or engagement programs. You know beforehand who’s most likely to shape up that way. Your team can act to ensure that happens and deepen your relationship, even in its earliest stages.
These are just some examples of how to use predicted customer lifetime value. There are undoubtedly many more for your particular business and industry.
How Predicting LTV Works
Time to find out how we achieve that glimpse of the future! In machine learning, there are two broad types of predictive models: classification and regression.
Classification models try to predict which “class” something fits into. First, they use historical data to identify meaningful patterns that connect with certain outcomes. Then, they look for those patterns in new data to predict the most likely outcomes or “classes” for the new data.
For example, we could create a classification model that looked at existing customers who’d been manually classified into “lower-value” and “higher-value” classes. The model could then predict which new customers would most likely fit into one class or the other.
Predicting how customers would fit into those classes might be somewhat helpful. But it’s far more useful in predicting LTV to predict a specific, numeric future value for each customer. Machine learning models for regression fit this task. These models offer a numeric prediction for each customer’s lifetime value.
Want to learn more about the basics of predictive analytics? Check out our guide, The What and Why of Predictive Analytics, for a quick, accessible intro!
So how does the regression model figure out the specific prediction for each customer? In a super-simple regression model, you can compare two variables and figure out their relationship. For example, it could be the case that there’s a relationship between your customers’ first purchase amount and their LTV. We might visualize that relationship like this:
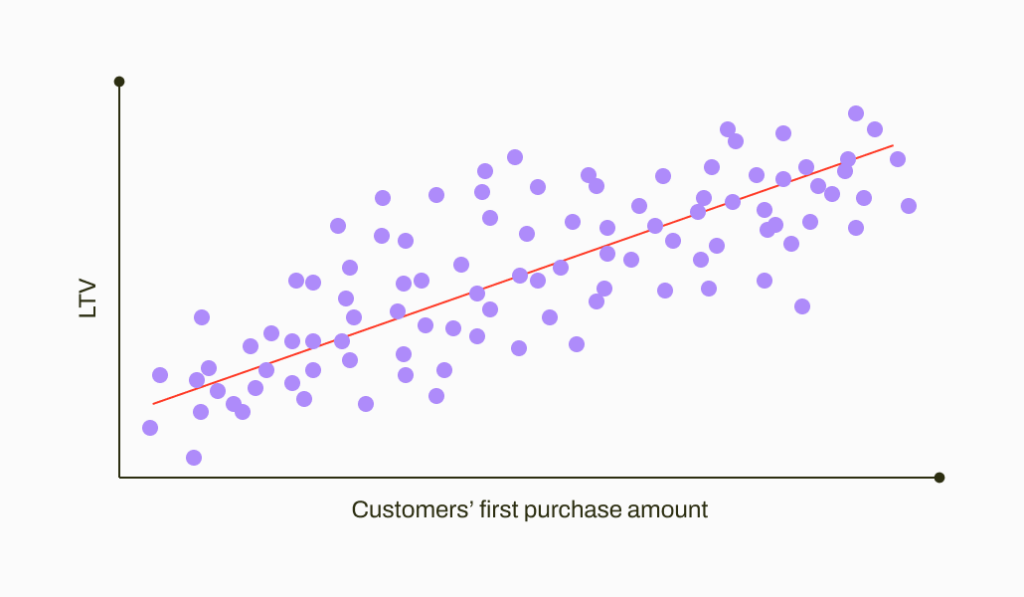
Each point in the visualization represents where one customer sits — at the intersection of their first purchase amount and lifetime value. We can see that customers further to the right who bought more in their first purchase also have higher lifetime value.
The points in the visualization aren’t the most essential elements, though you undoubtedly love each of the customers they represent! What’s valuable is that we can draw a line through all the points.
Regression analysis devises an equation to draw the line that best fits our points, staying as close to all of them on average as possible. To be sure, some points are further from the line, and some are right on it.
But on average, the line “fits” the data as well as possible. Furthermore, the equation that creates that line of “best fit” can predict LTV when we know customers’ first purchase amount but not their LTV. How fantastic is that?!
Pushing Beyond Human Limitations to Maximize LTV
It’s cool that we can do regression with just two variables, sure. But fortunately, in the real world, we have a lot more information about customers.
Regression models can incorporate many more variables. And that’s good, because with more data to choose from, regression models can generate more accurate predictions. For example, maybe the customer’s number of website visits, their clicks on social media ads, and the number of their interactions with customer service reps are also strongly related to their LTV.
However, common BI approaches are constrained by humans’ assumptions and cognitive limitations. Predictive models overcome move beyond these “best guess” limitations because they can figure out even much more complex patterns among multiple variables and much larger datasets.
Regression models, like other explainable machine learning models, also reveal which variables are most important in determining the outcome — in this case, LTV. This information is called “feature importance.” In Pecan’s platform, you can see which variables most affected LTV predictions for each customer. That information lets you determine the right approach for every individual.
At the same time, examining feature importance information across the board can also help you proactively shape larger campaigns and strategies to boost LTV and other KPIs. This beneficial information isn’t something humans can quickly determine by looking at spreadsheets or visualizations. Instead, machine learning models rapidly bring those details to the surface to predict the future so you can get proactive.
Knowing how predictive models work is rewarding. But what’s especially satisfying about lifetime value prediction is that your efforts mutually benefit you and your high-value customers. They’ll undoubtedly be thrilled by the TLC and personalization they receive. And, of course, you’ll be delighted by the positive impact of a stronger relationship on your most important outcomes, too.
Learn more about how predicting LTV can help you identify, nurture, and retain your most valuable customers. Get in touch today to find out how Pecan’s predictive analytics solution makes this possible.
Read more in the Predictive Frameworks series:
- Stop Customer Churn in its Tracks with Predictive Analytics
- Scaling Demand Forecasting with AI-Powered Predictive Analytics
- Predicting Success for Cross-Sell & Upsell Offers
- How to Implement High-Converting Cross-Sell and Upsell Strategies with Predictive Analytics
- Why You Need to Predict Customer Lifetime Value